

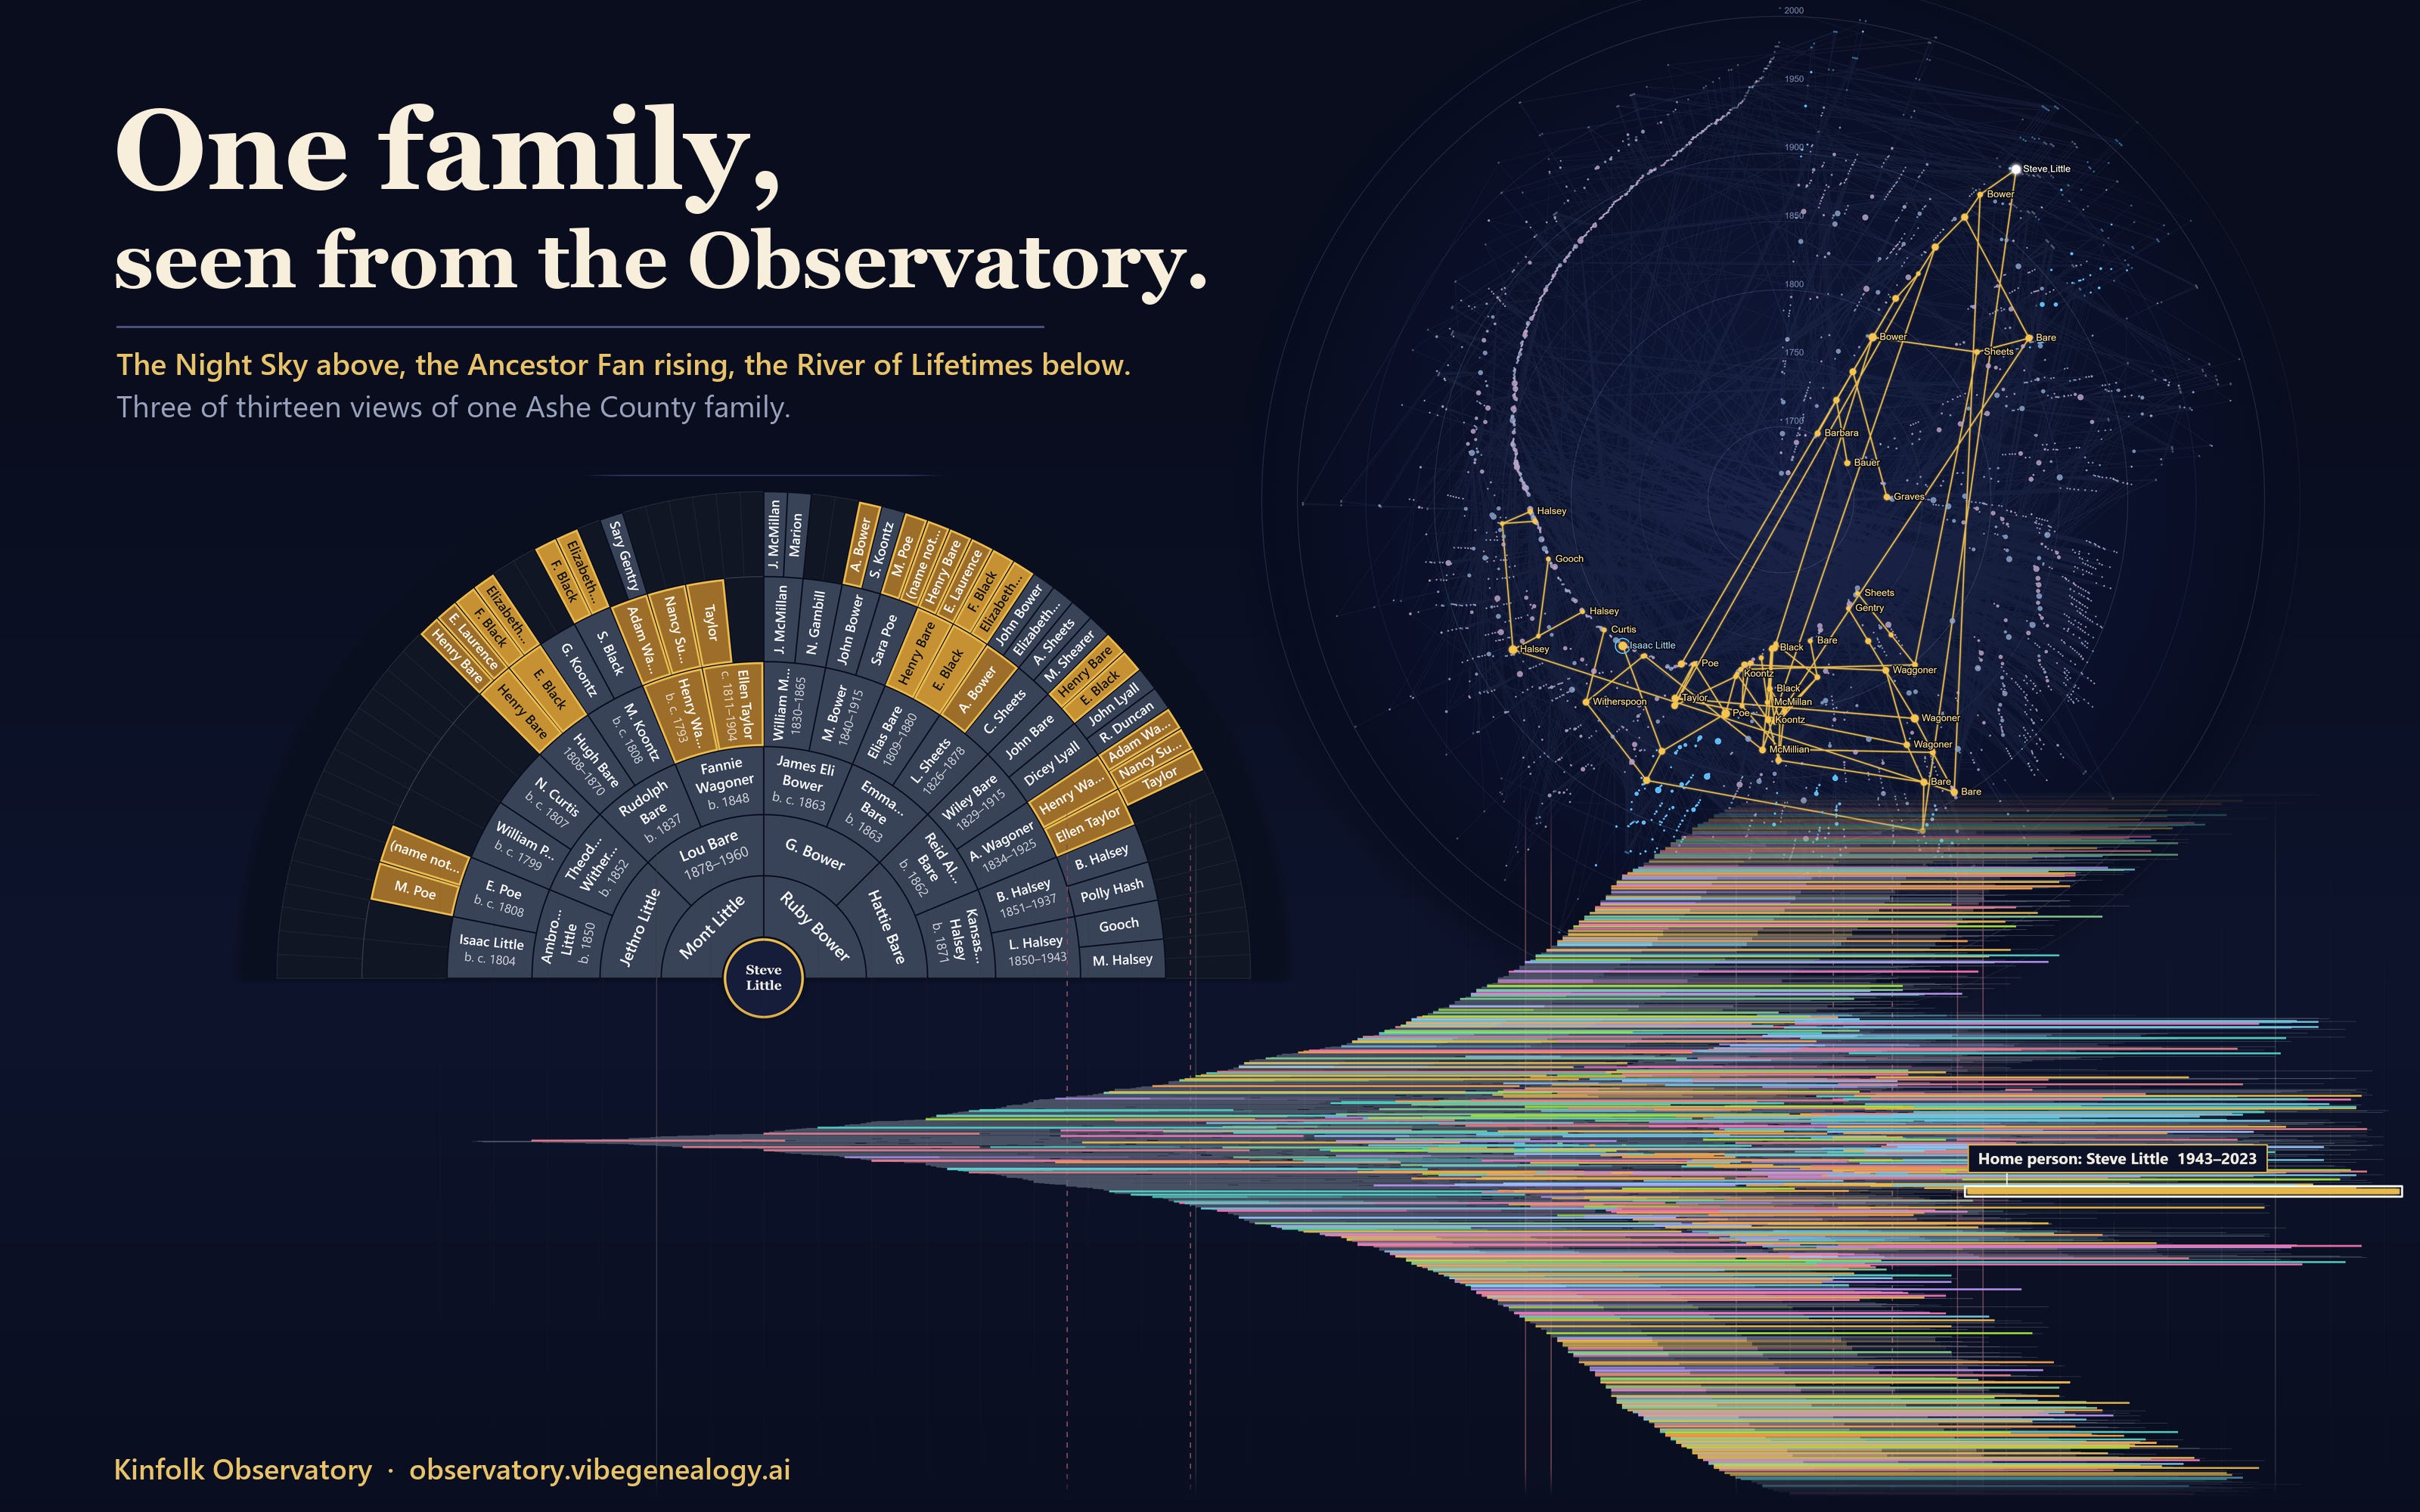
This week, Anthropic released Fable 5.2, the newest advance in its Claude family of AI models. It is their largest, strongest publicly released model.
It is also expensive. So I had one question: is Fable 5.2 worth twice the price of Opus 5.5, the very capable favorite?
To find out, I asked Fable to find the best source of my family data on my computer. It chose a GEDCOM file (the standard file that family-tree programs export) with 3,571 people in it. Then I asked for one thing:
“the most incredible visual exploration of my family data as you can”
What Fable 5.2 generated in response stunned me.
When I came back at 8 am, about a half-hour later, one web page was waiting on my computer. It drew my 3,571-person tree ten different ways: a star map, an ancestor fan, an hourglass chart, a river of lifetimes, a picture of which families married which, a relationship finder, a life story, and more. Fable had split the job among ten copies of itself (called “subagents”) and finished in 25 minutes.
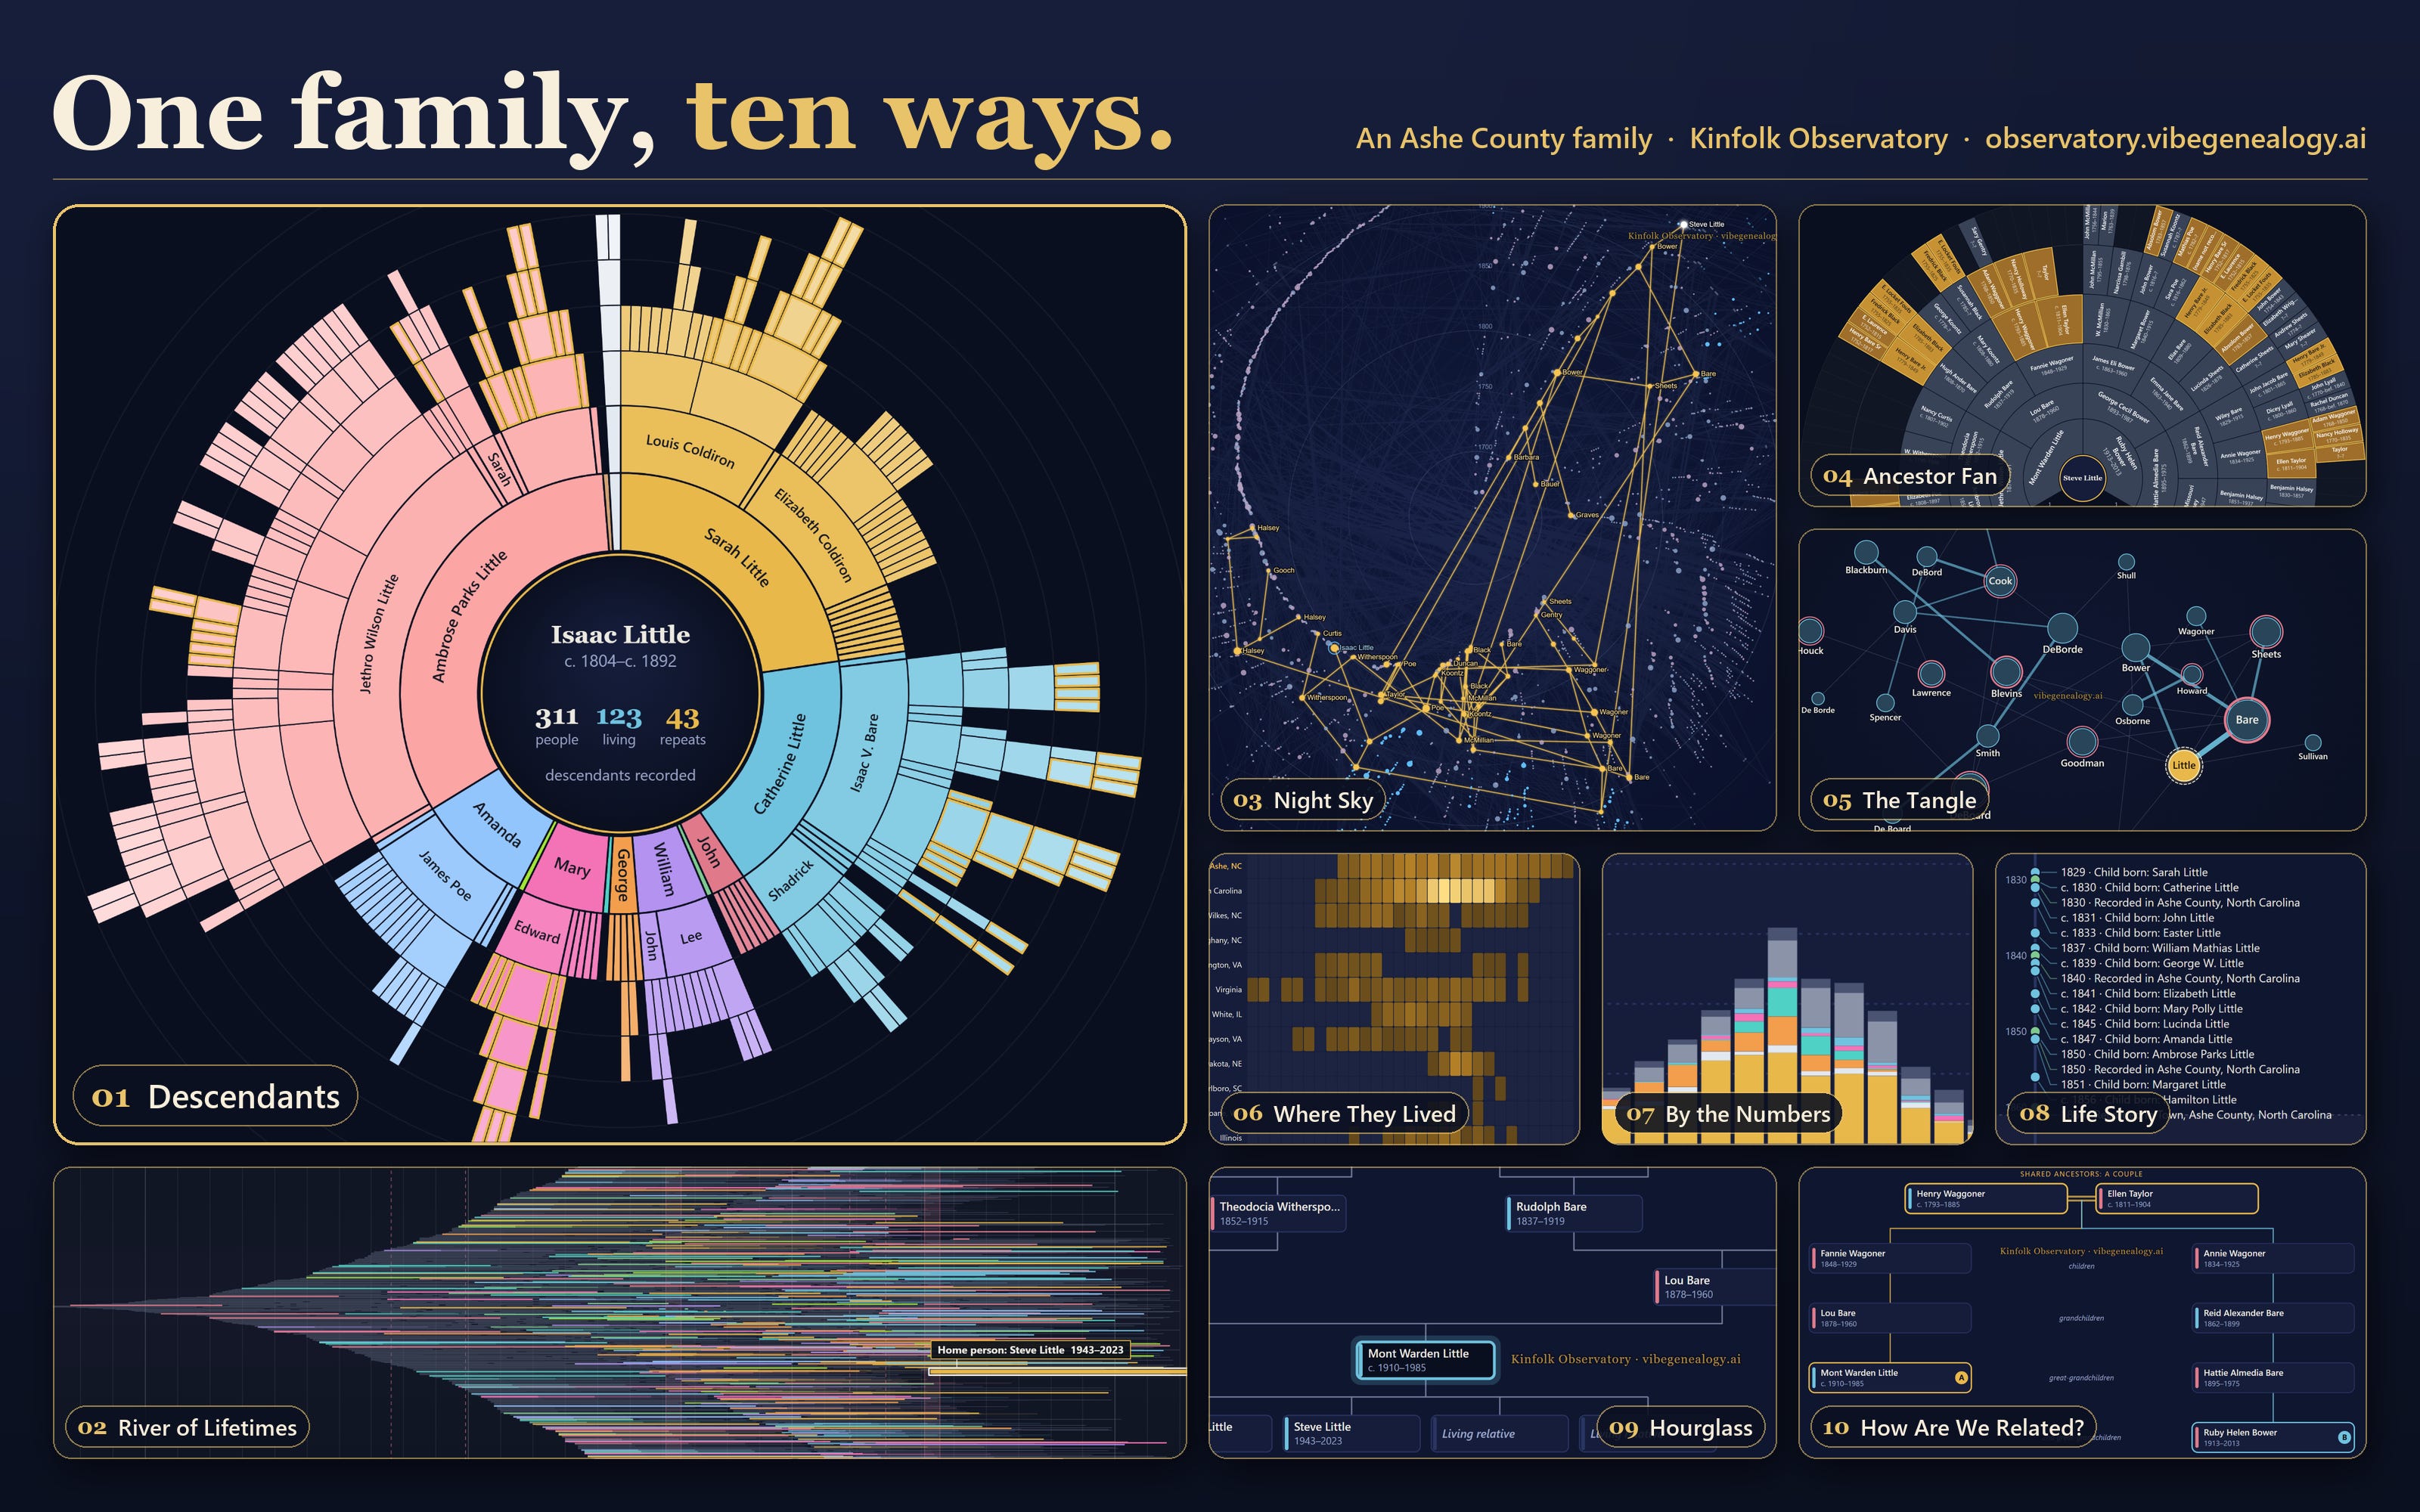
That was a “one-shot”: what an AI makes from a single prompt, with no back-and-forth. I typed one request, walked away for 35 minutes, and came back to the first version of what you see here.
That morning’s one-shot grew into Kinfolk Observatory, a free tool with 13 ways to explore a family tree:
https://observatory.vibegenealogy.ai/
Your family file stays on your device. The Observatory reads and works with it in your browser, without uploading it.
No AI sees or processes your file in the Observatory. The browser follows the tool’s built-in rules. AI helped me build the tool, no AI is used to run the tool.
Vibe Genealogy doesn’t see, track, or keep anything from your family file. You can use the Observatory without an account or sign-in. For free!
To try your own tree, export a GEDCOM (a family tree file usually ending in .ged) from your genealogy program, then choose Load your family file.
About that price
Fable 5.2 is expensive. At standard API rates (what software pays to call the model directly), it costs $8 per million tokens going in and $40 per million tokens coming out. A million tokens is about the length of the first five Harry Potter books. That is exactly twice the cost of Opus 5.5.
So, is it worth twice the price of Opus 5.5?
Yes, when it is tasked correctly: with the hardest, long-running, big jobs.
For most work, Opus 5.5 is an extremely capable model, and it remains my daily-driver after I’ve exhausted my Fable 5.2 usage, and I let both Fable and Opus assign the smaller workhorse models Sonnet and Haiku as subagents as they deem helpful and efficient.
What made this a hard job
No GEDCOM file is straightforward. Every genealogy program writes them a little differently, and every family breaks the rules somewhere.
And my family tree is more twisted than many. My families are from the mildly endogamous Appalachian region, where people married within the same community for generations, so the relationships are complex:
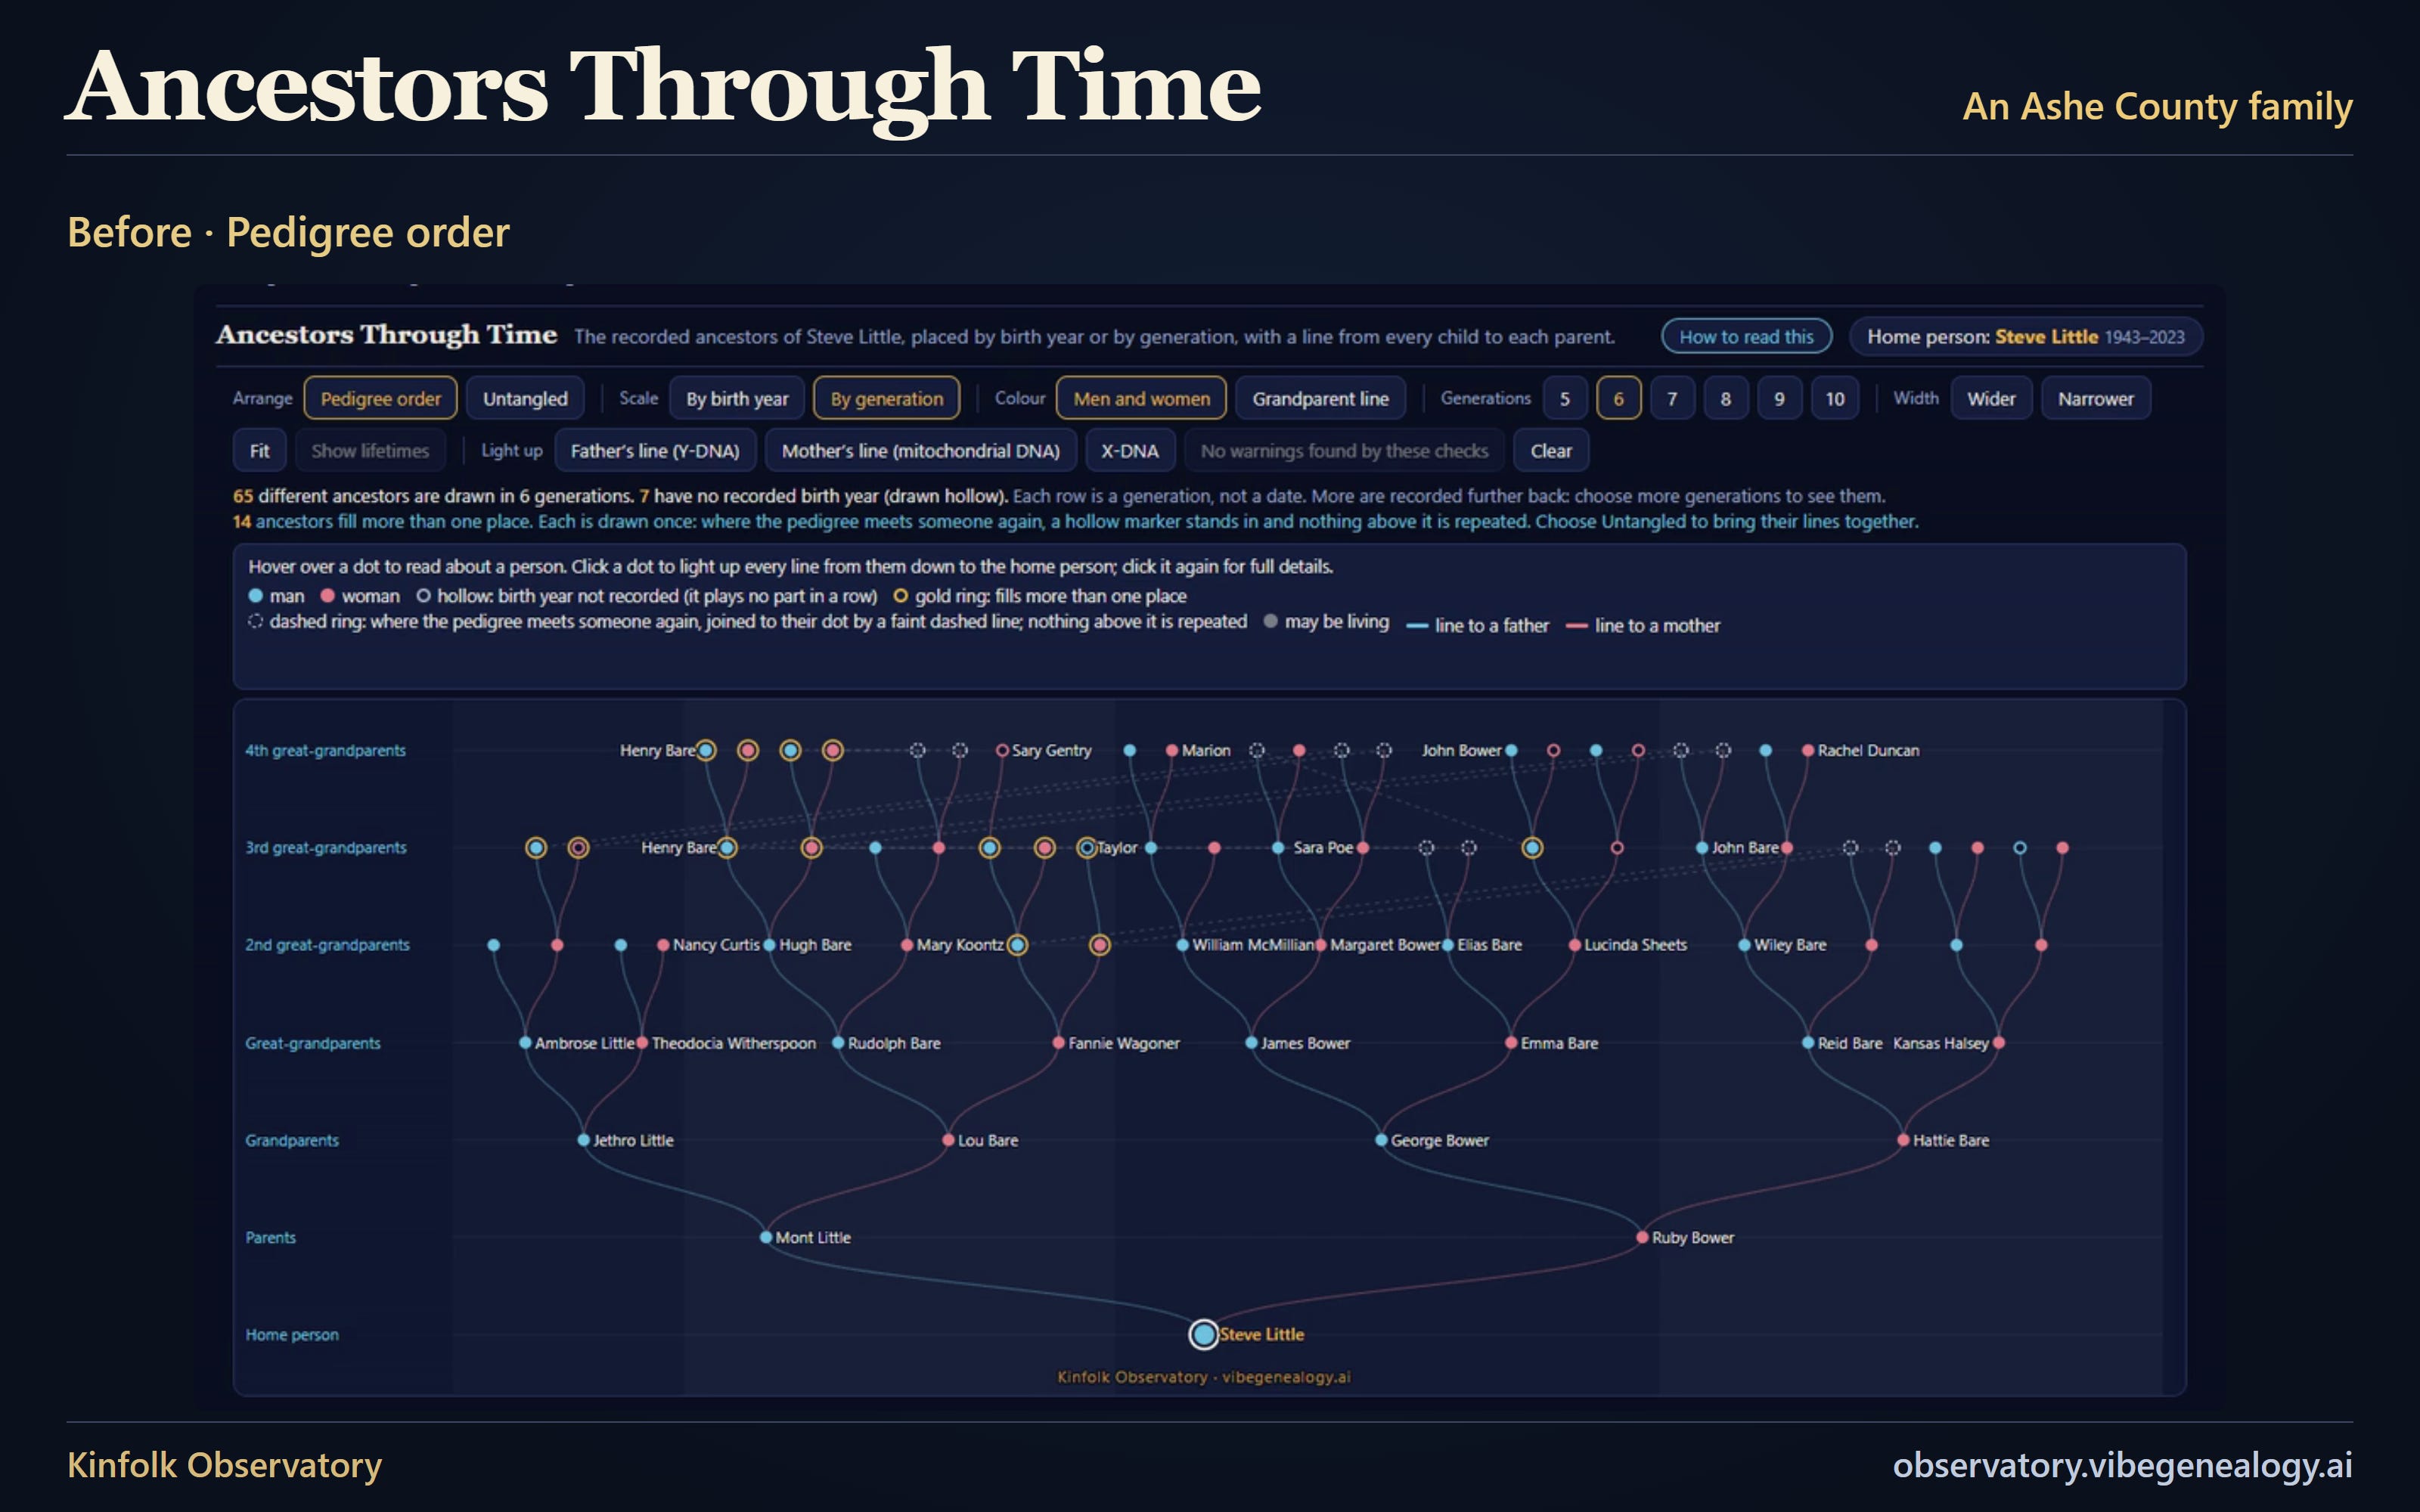
Pedigree collapse. The same ancestor appears more than once in a family tree, because second or third cousins married. That was very common in that time and place.
Multiple relationships. This is different from pedigree collapse: being related to someone in more than one way, within one person’s ancestry.
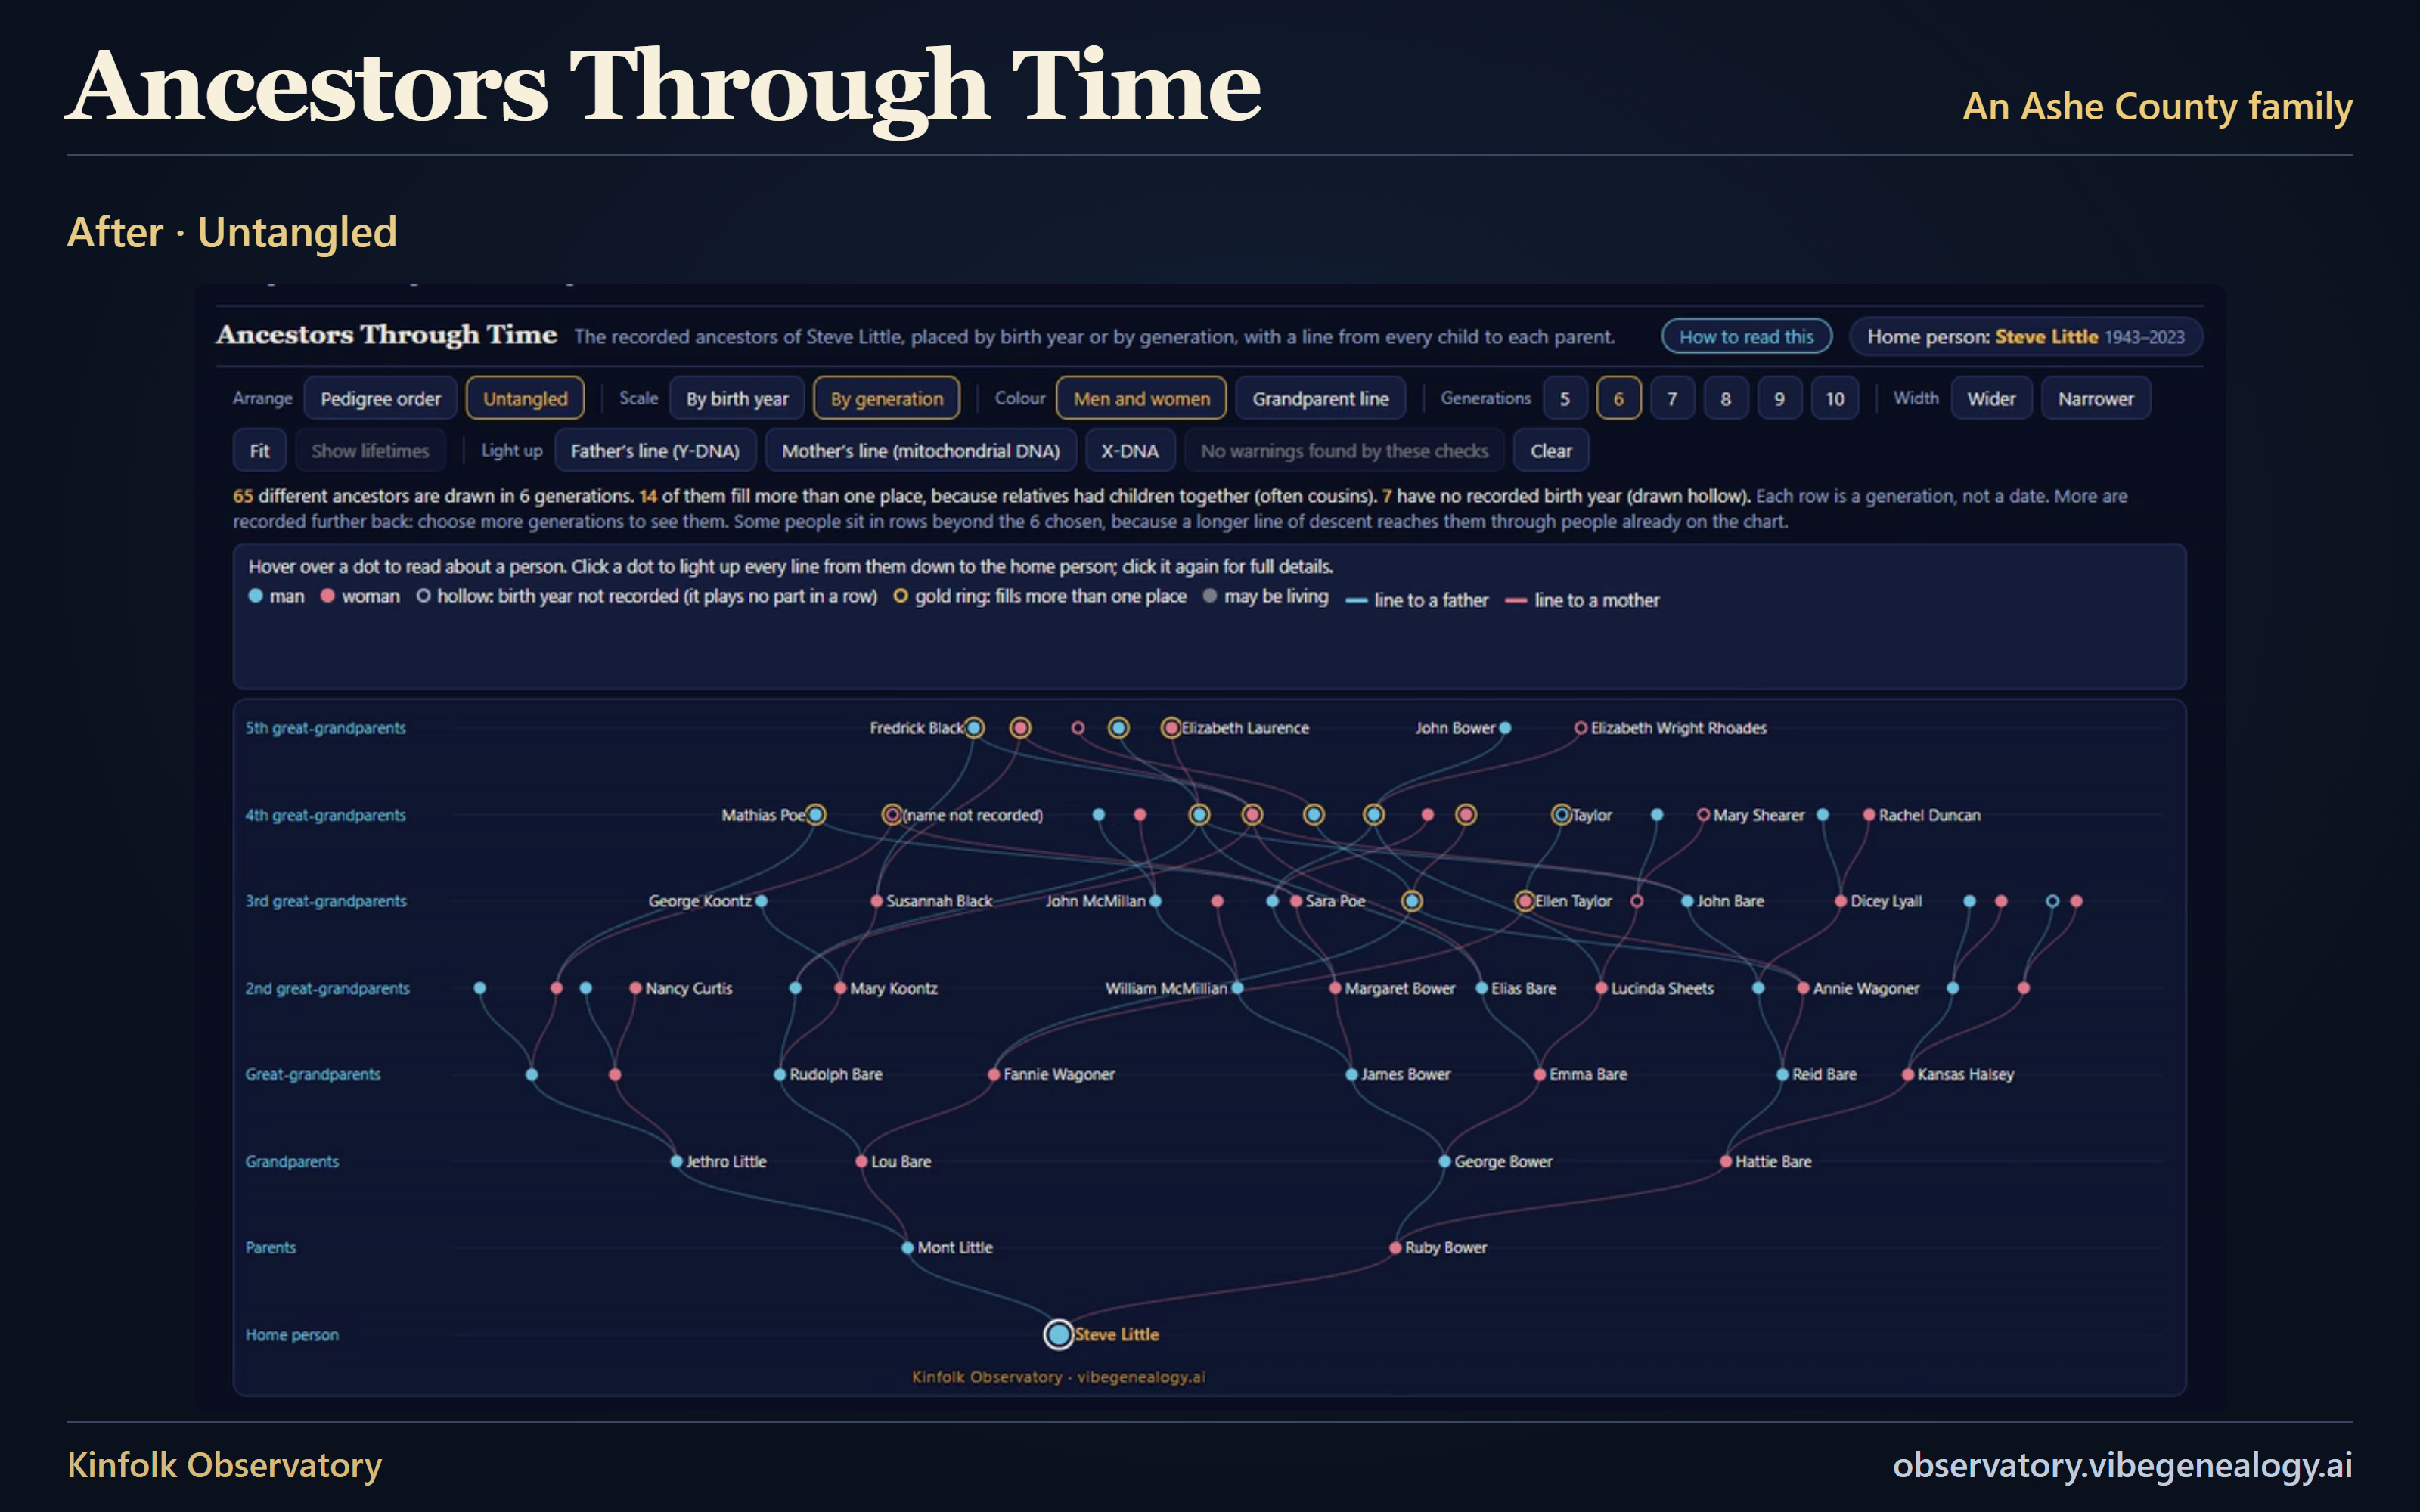
A traditional pedigree chart can show all of this, but it is hard to follow. Here are the same recorded ancestors, arranged two ways:
Your turn
Here’s this Friday’s fun prompt. First, one caution: when you give a GEDCOM file to an AI chat, the AI reads the whole file. So export a copy without living people. Most genealogy programs offer that as an option when you export.
Then give that copy to your favorite AI model and ask it to make something incredible from it. Let it decide what that means.
Here is exactly what I typed, if you’d like to borrow it:
Fable 5.2, our usage credits reset soon, meaning any unused allotment is lost, wasted. I want you to spend the time between now and then, about 35 minutes, making the most incredible visual exploration of my family data as you can. Spin-up as many duplicates of yourself as needed to manage this task before the tokens expire, and you decide what “the most incredible visual exploration of my family data as you can” means, as long as you finish before the deadline. You need to work autonomously--I’ll be back in 35 minutes. GO!
Tell me what yours made.
Happy Friday the Thirteenth! Have a great weekend!
— Steve
Appendix: a tour of the 13 views
My father and I share a name. In most of the pictures below, it is his name you see at the center: Steve Little, 1943–2023.
The tree is my own family, rooted in Ashe County, North Carolina. A copy of 3,214 people is built into the Observatory as an example, so you can open it and follow along. The names and details of people who may be living are hidden, apart from my own name.
Two things to know before you look. Many views start from one person, called the home person; here that is usually Dad. And each view shows what the tree records, not what is proved.
1. Night Sky
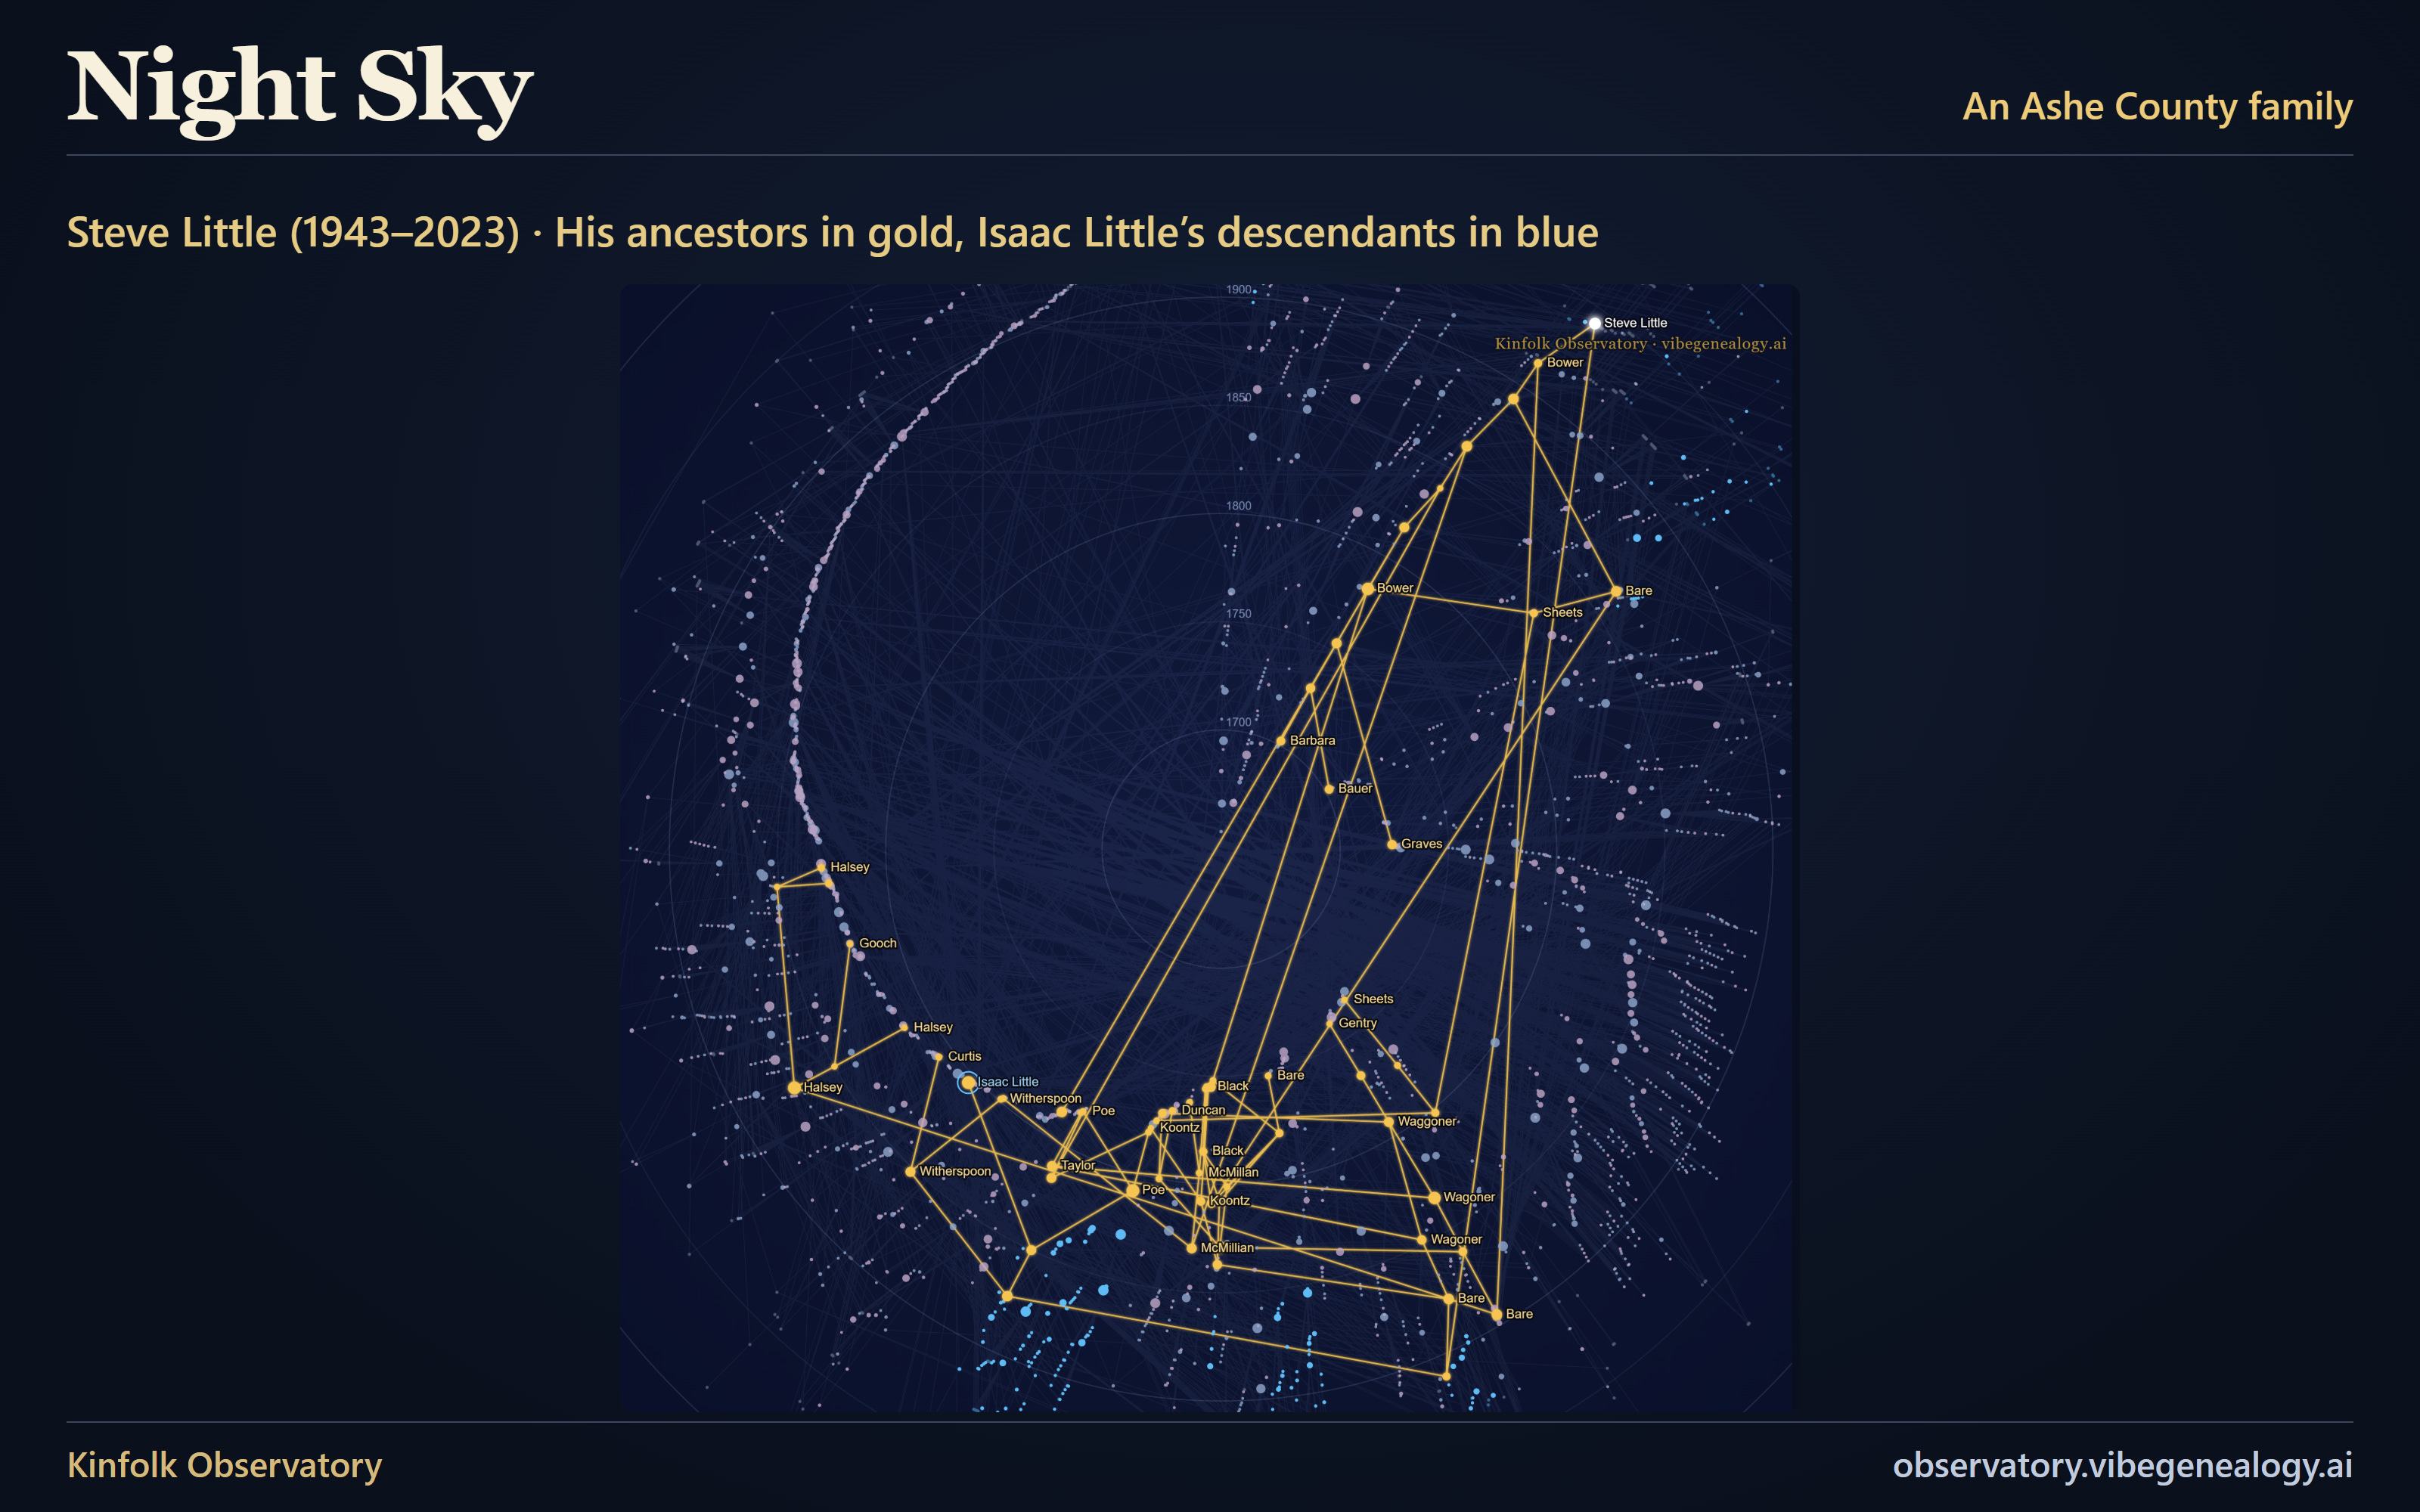
What it shows. Each person the page can place becomes one star. The earliest births sit in the middle and the years move outward, with children placed beside their parents so each family line fans out toward the edge. Zoom in and point at a star to see whatever details are available.
In my family. The sky holds 3,119 stars. The gold lines trace my father’s recorded ancestors. Blue marks descendants of Isaac Little, born about 1804, recorded here as my 3rd great-grandfather.
2. Ancestor Fan
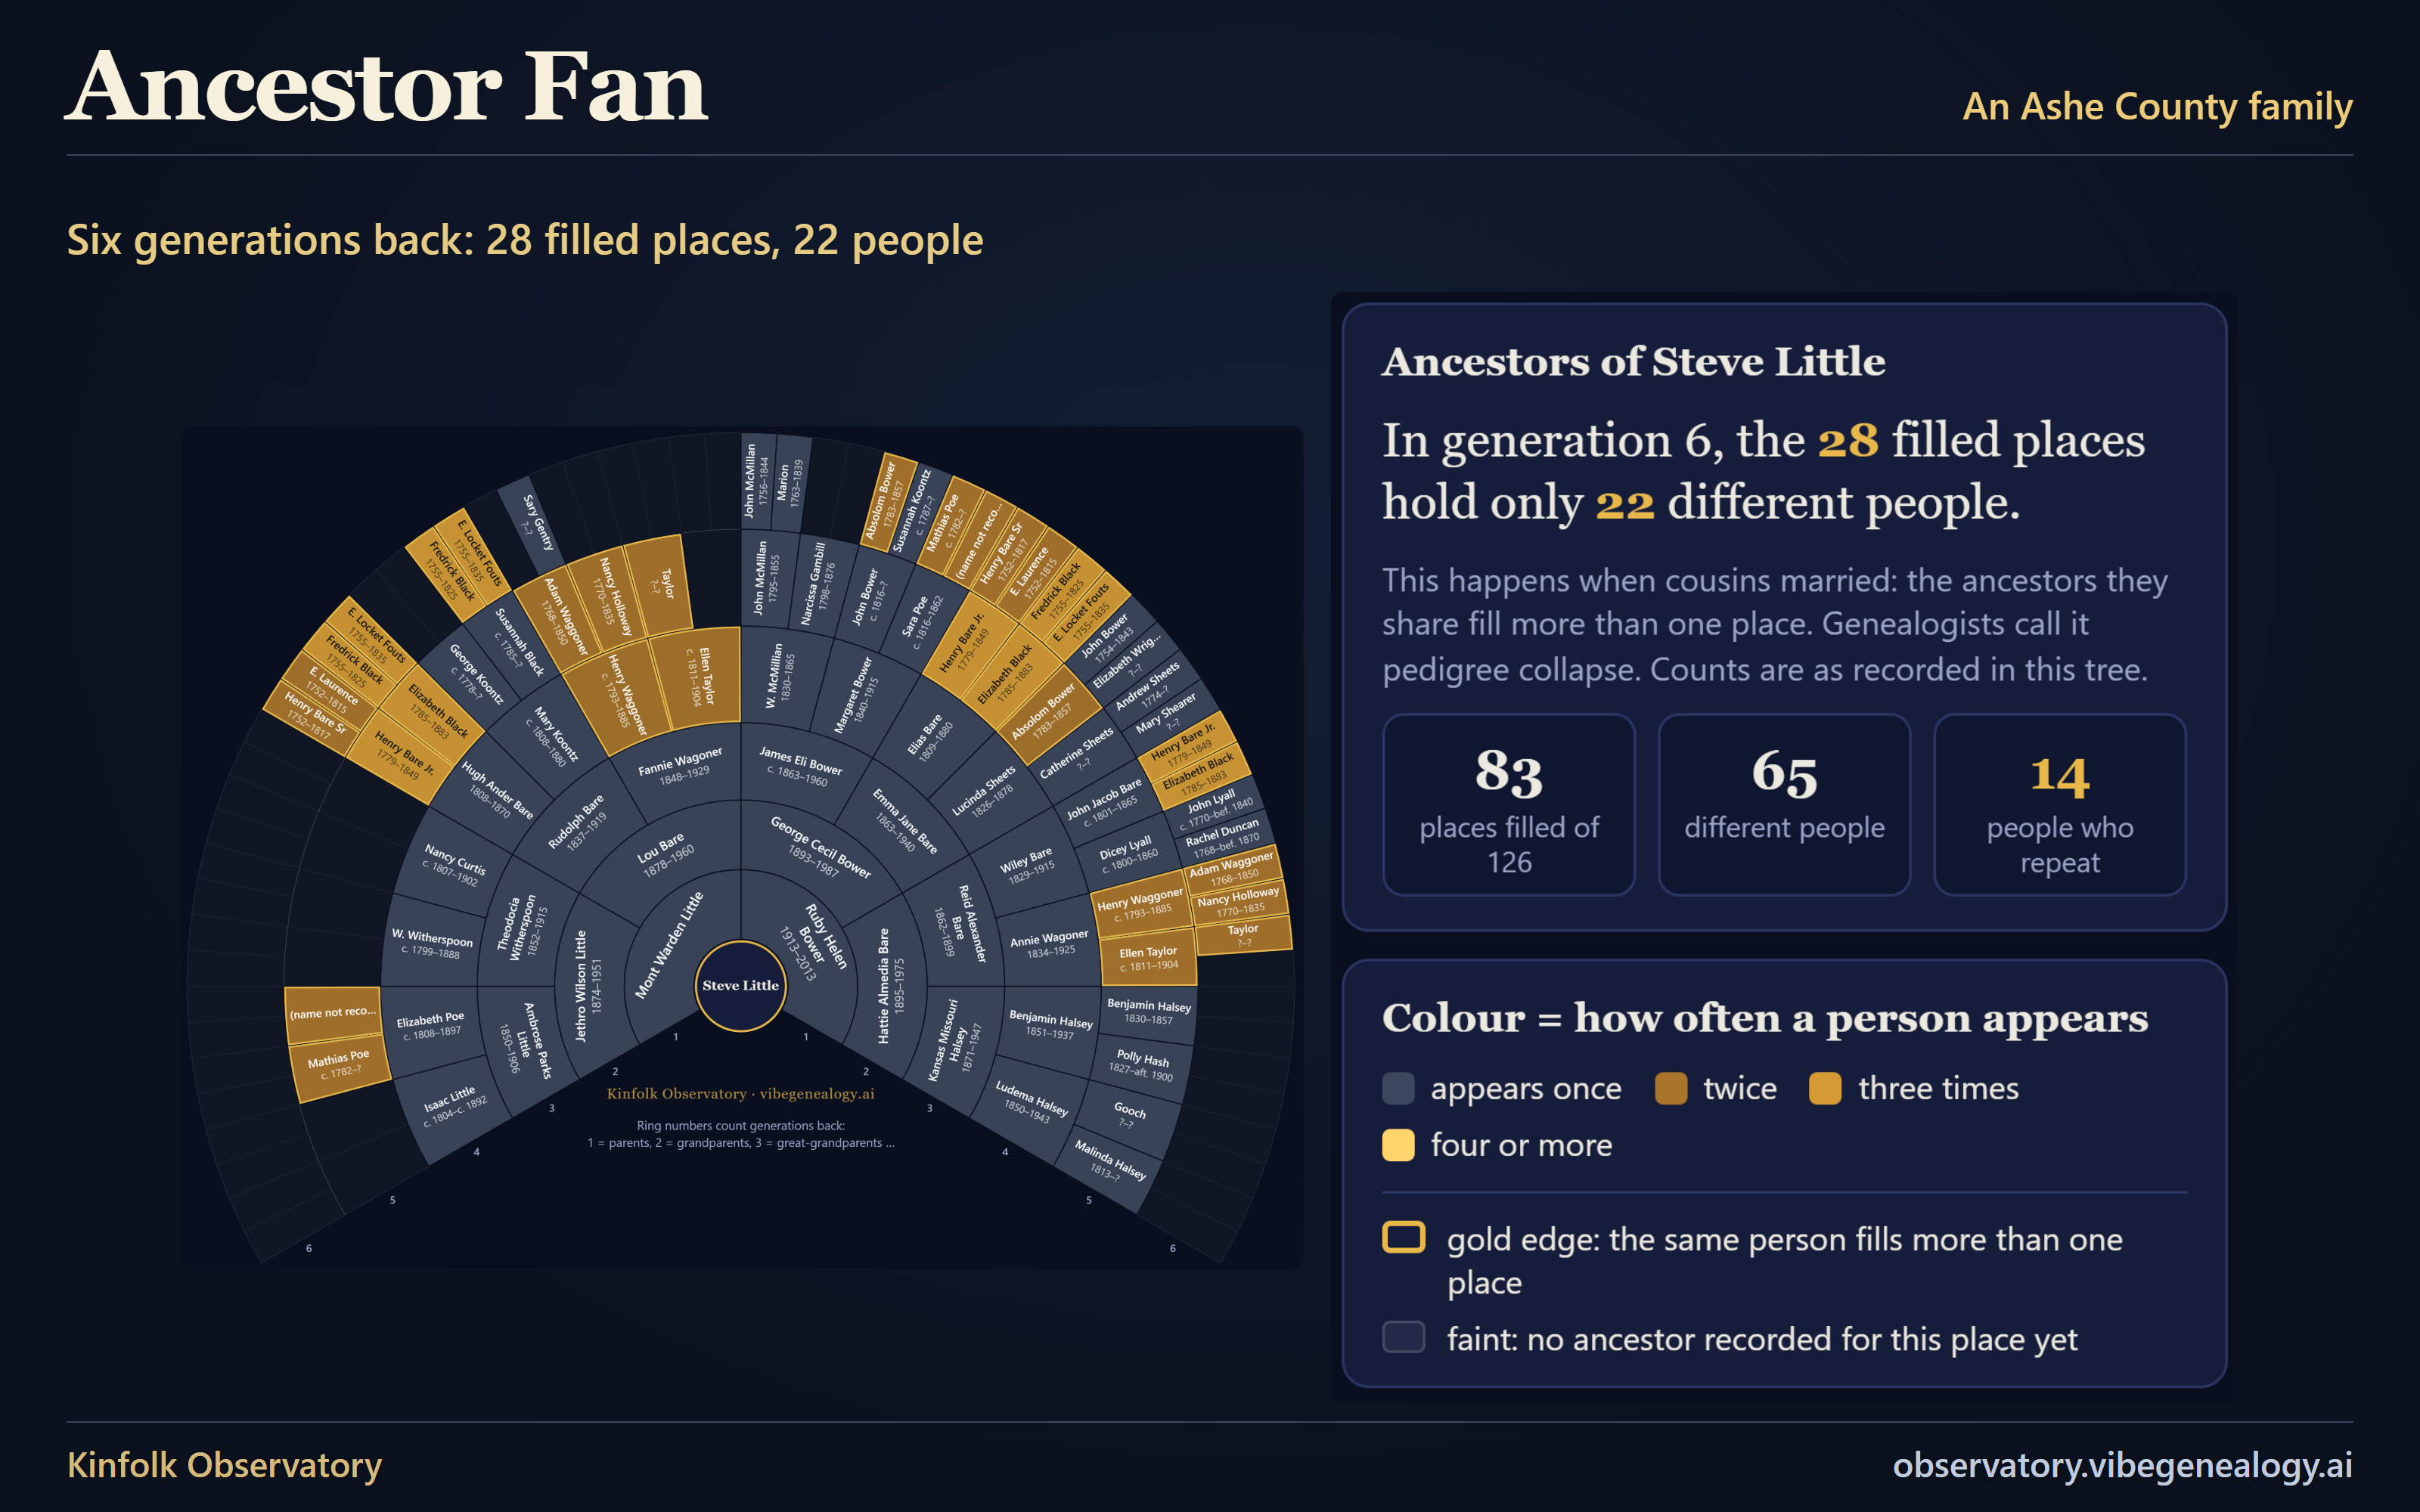
What it shows. The home person is in the middle. Each ring outward is one generation further back, with the father’s side on the left and the mother’s on the right. A gold edge marks a person who fills more than one place in the fan. That happens when a couple share an ancestor, usually because cousins married. It is called pedigree collapse: the tree folds back on itself, so there are fewer different ancestors than places.
In my family. The gold edges are hard to miss. In the sixth generation back, 28 filled places hold 22 different people.
3. Hourglass
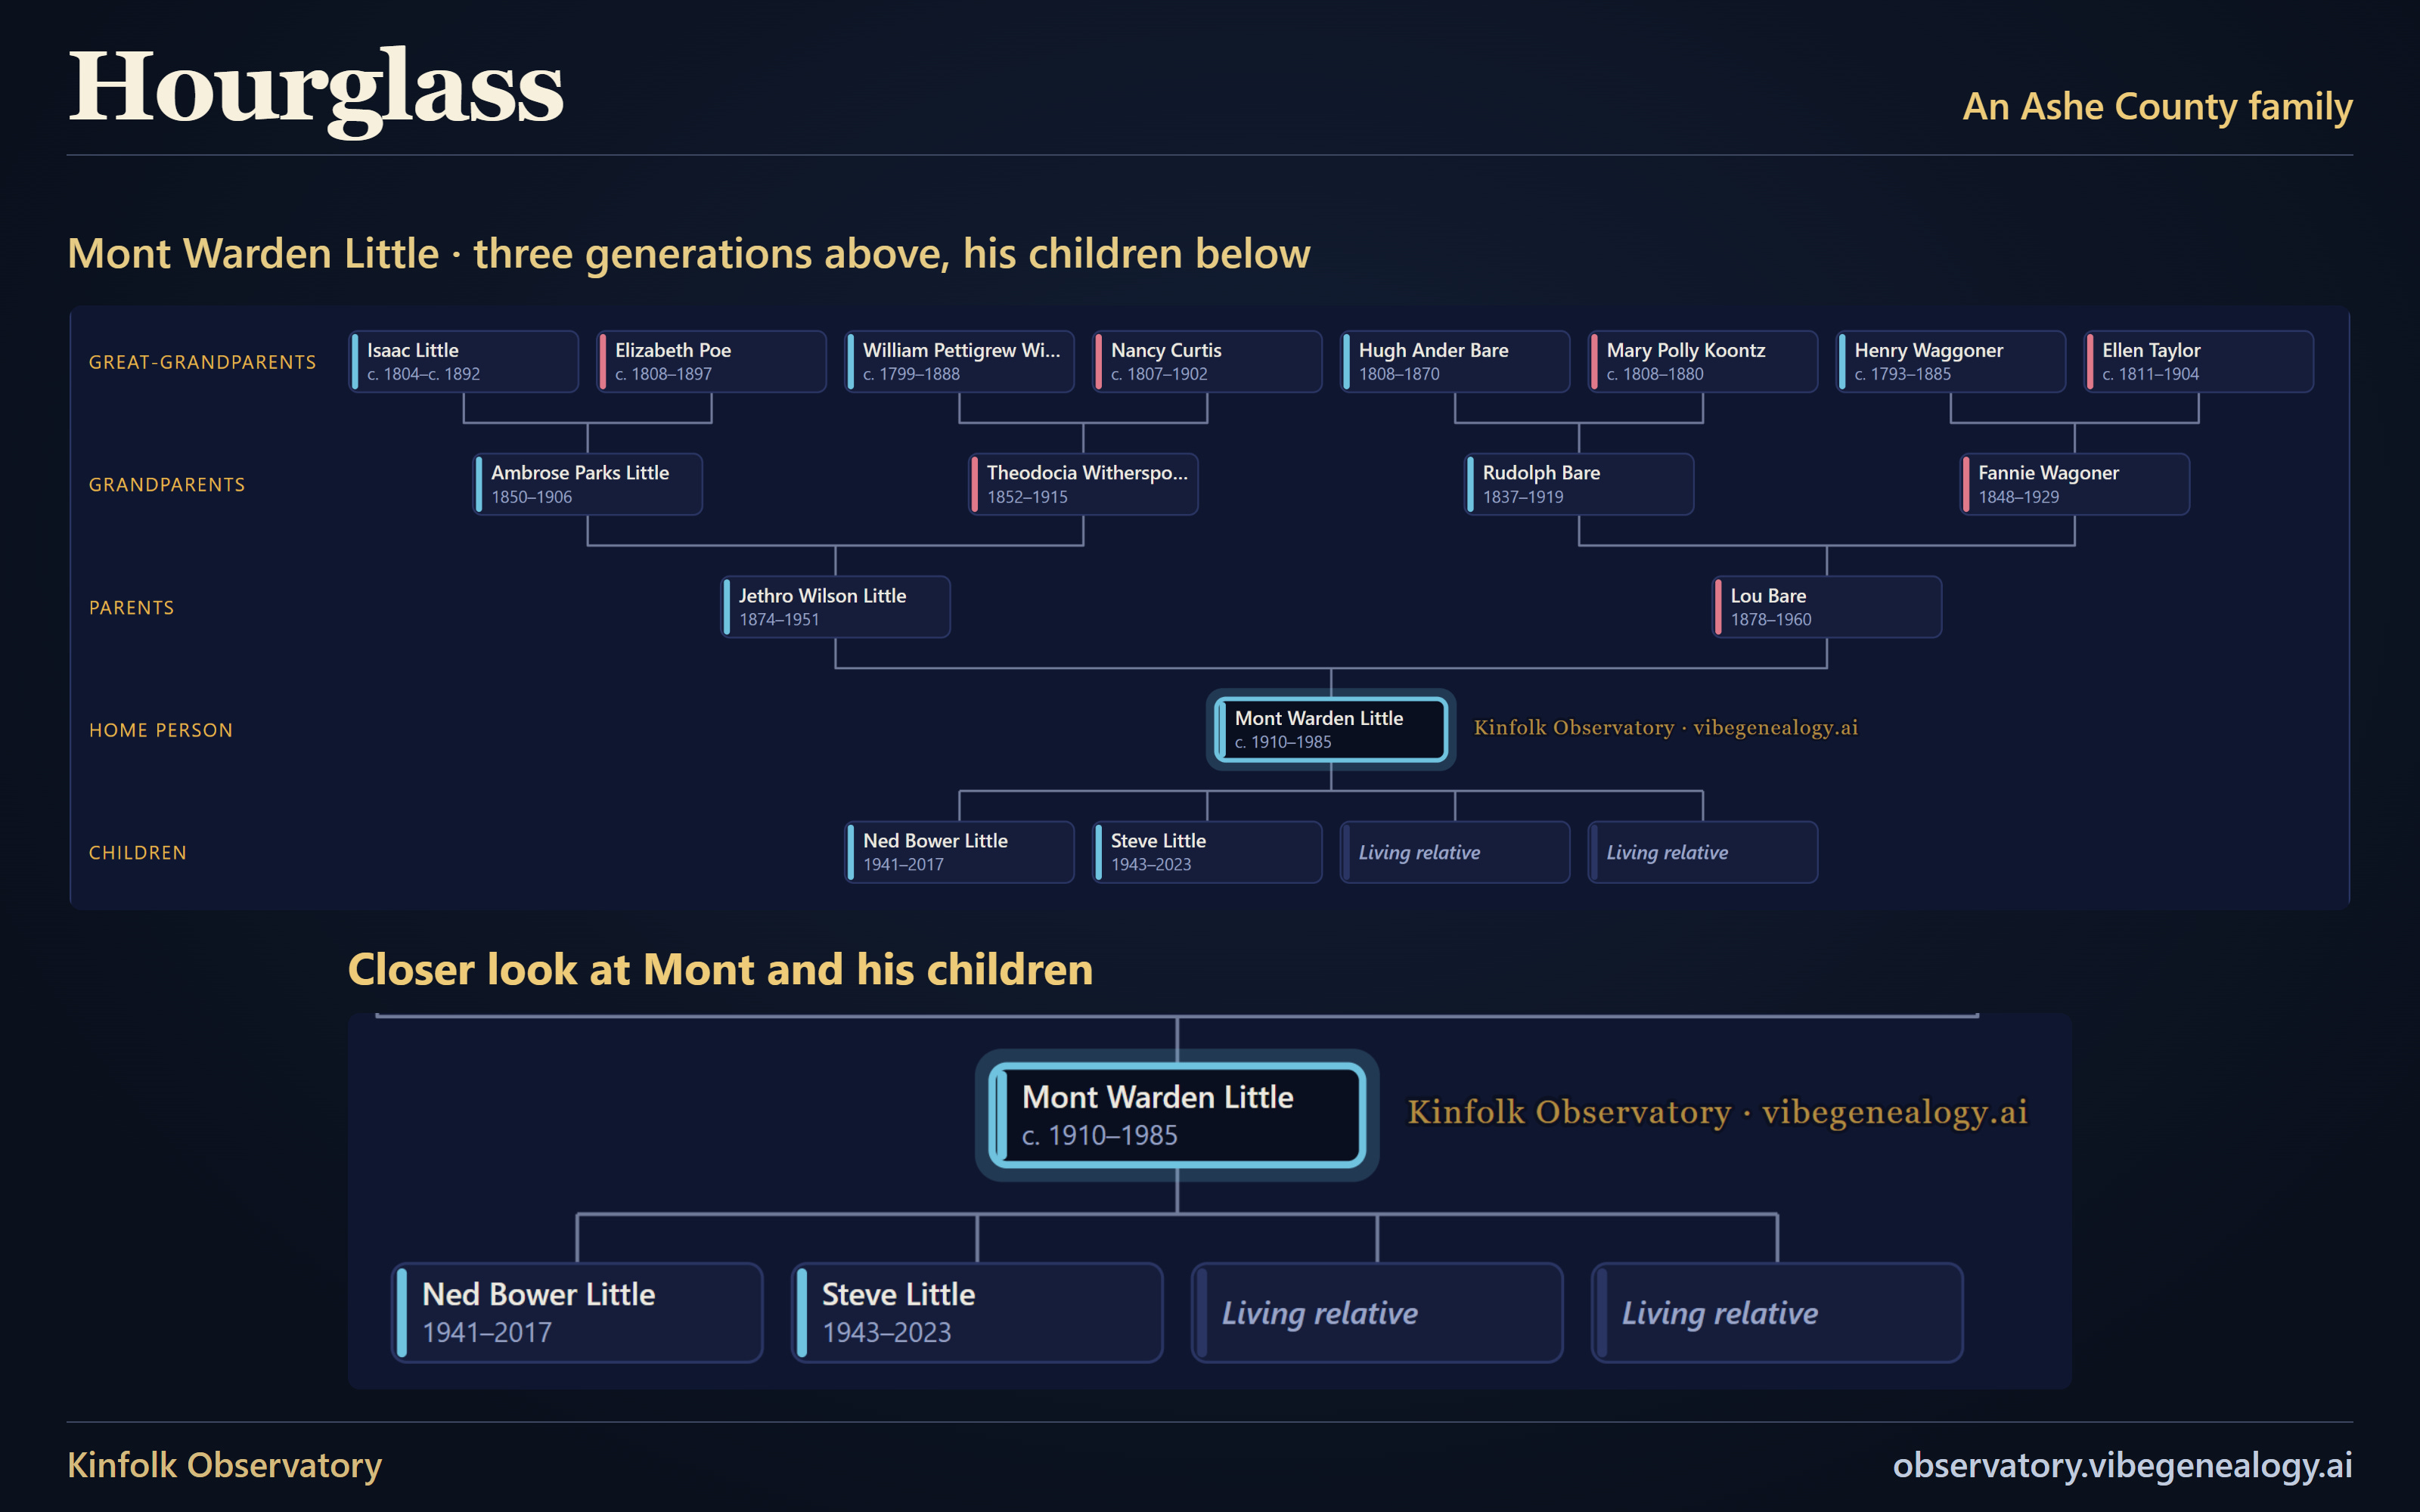
What it shows. The family-tree chart most of us learned first, drawn cleanly. Choose how many generations of ancestors rise above the person in the middle and how many generations of descendants hang below. Click a box for that person’s details, or double-click to put them in the middle.
In my family. For this one I put my grandfather, Mont Warden Little, in the middle. Three generations of his recorded ancestors rise above him, and his recorded children stand in a row below. A box marked “Living relative” is someone who may be living; the page hides their details.
4. Ancestors Through Time
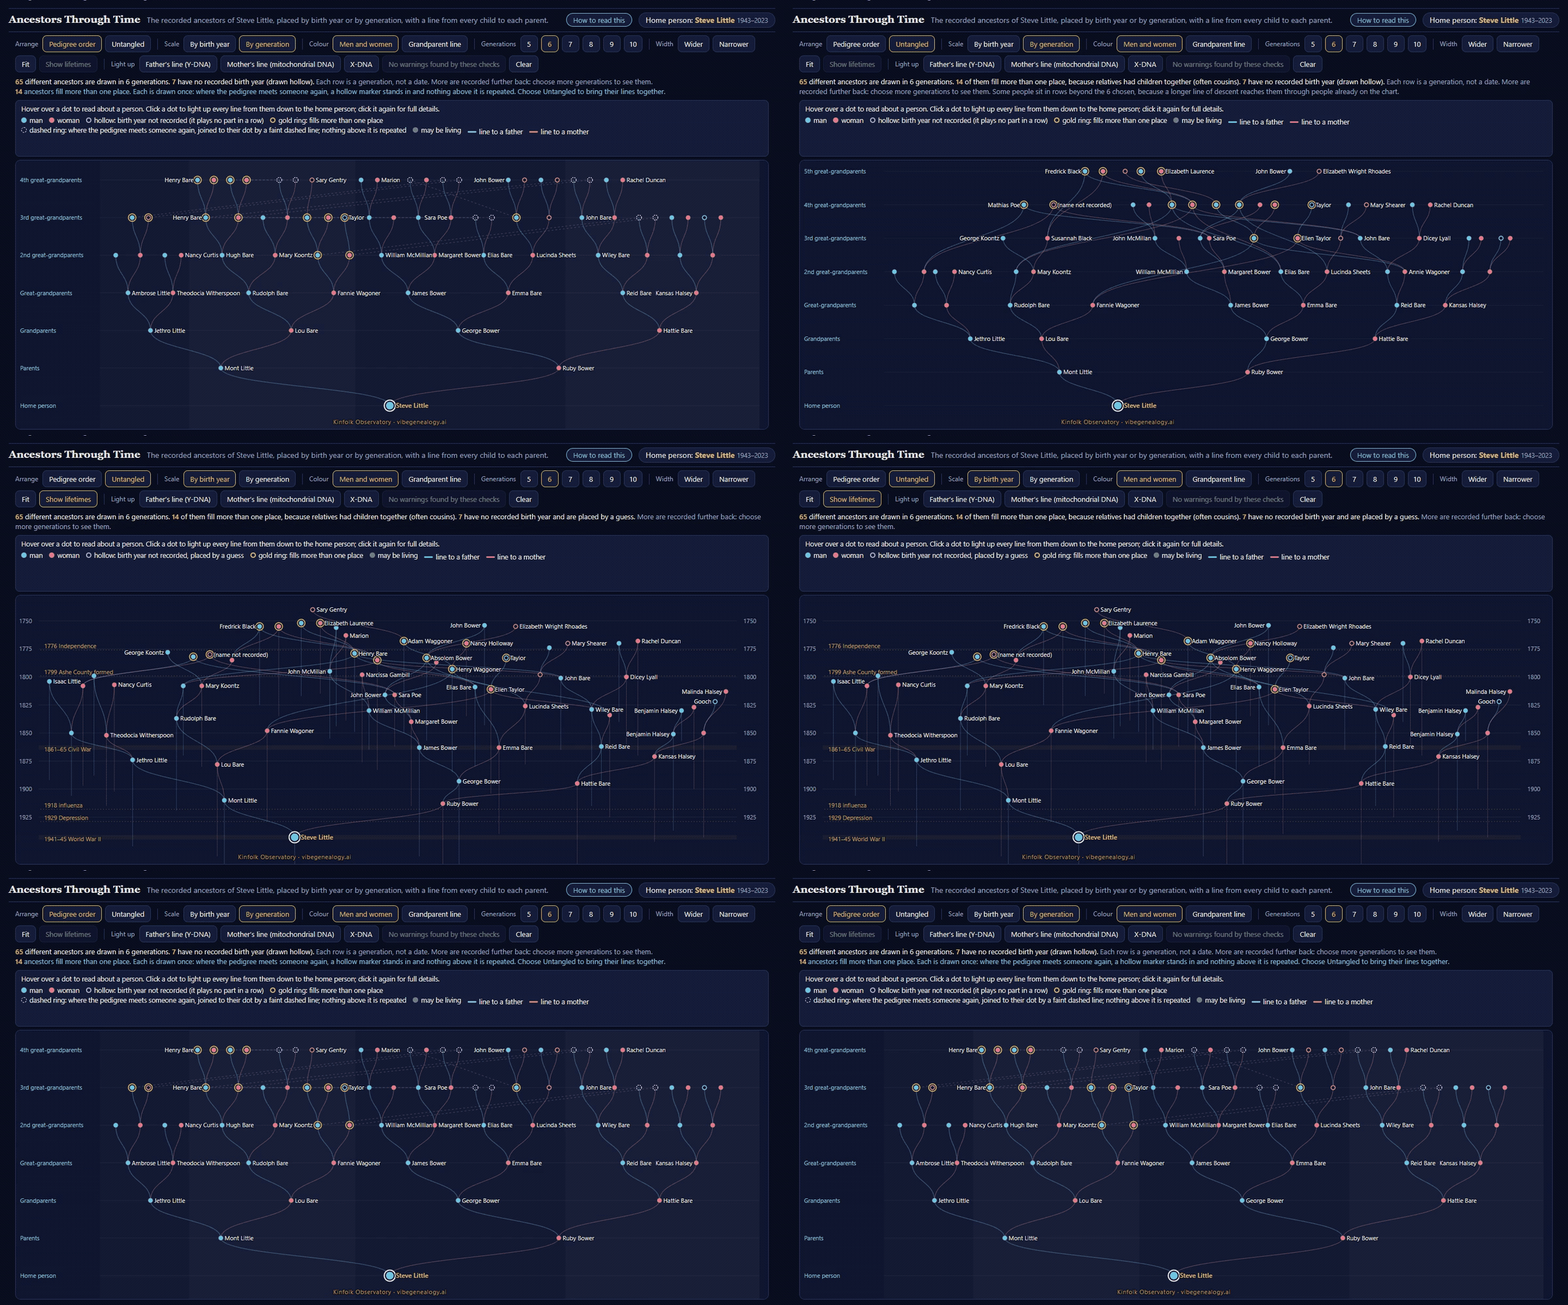
The two stills in the main story show the same change, for email programs that do not play a moving picture.
What it shows. Each dot marks an ancestor, with a line from every child to each parent. In ordinary tree order, a person who belongs in more than one place gets a dashed ring at each repeat. Choose Untangled and each person appears once, with all of their lines meeting. Choose By birth year to spread the dots along a calendar. Switches also light up the paths that three kinds of inherited DNA follow: father to father (Y-DNA), mother to mother (mitochondrial DNA), and X-DNA, which travels with the X chromosome.
In my family. The loop shows 65 different recorded ancestors in six generations. 14 of them fill more than one place.
5. River of Lifetimes
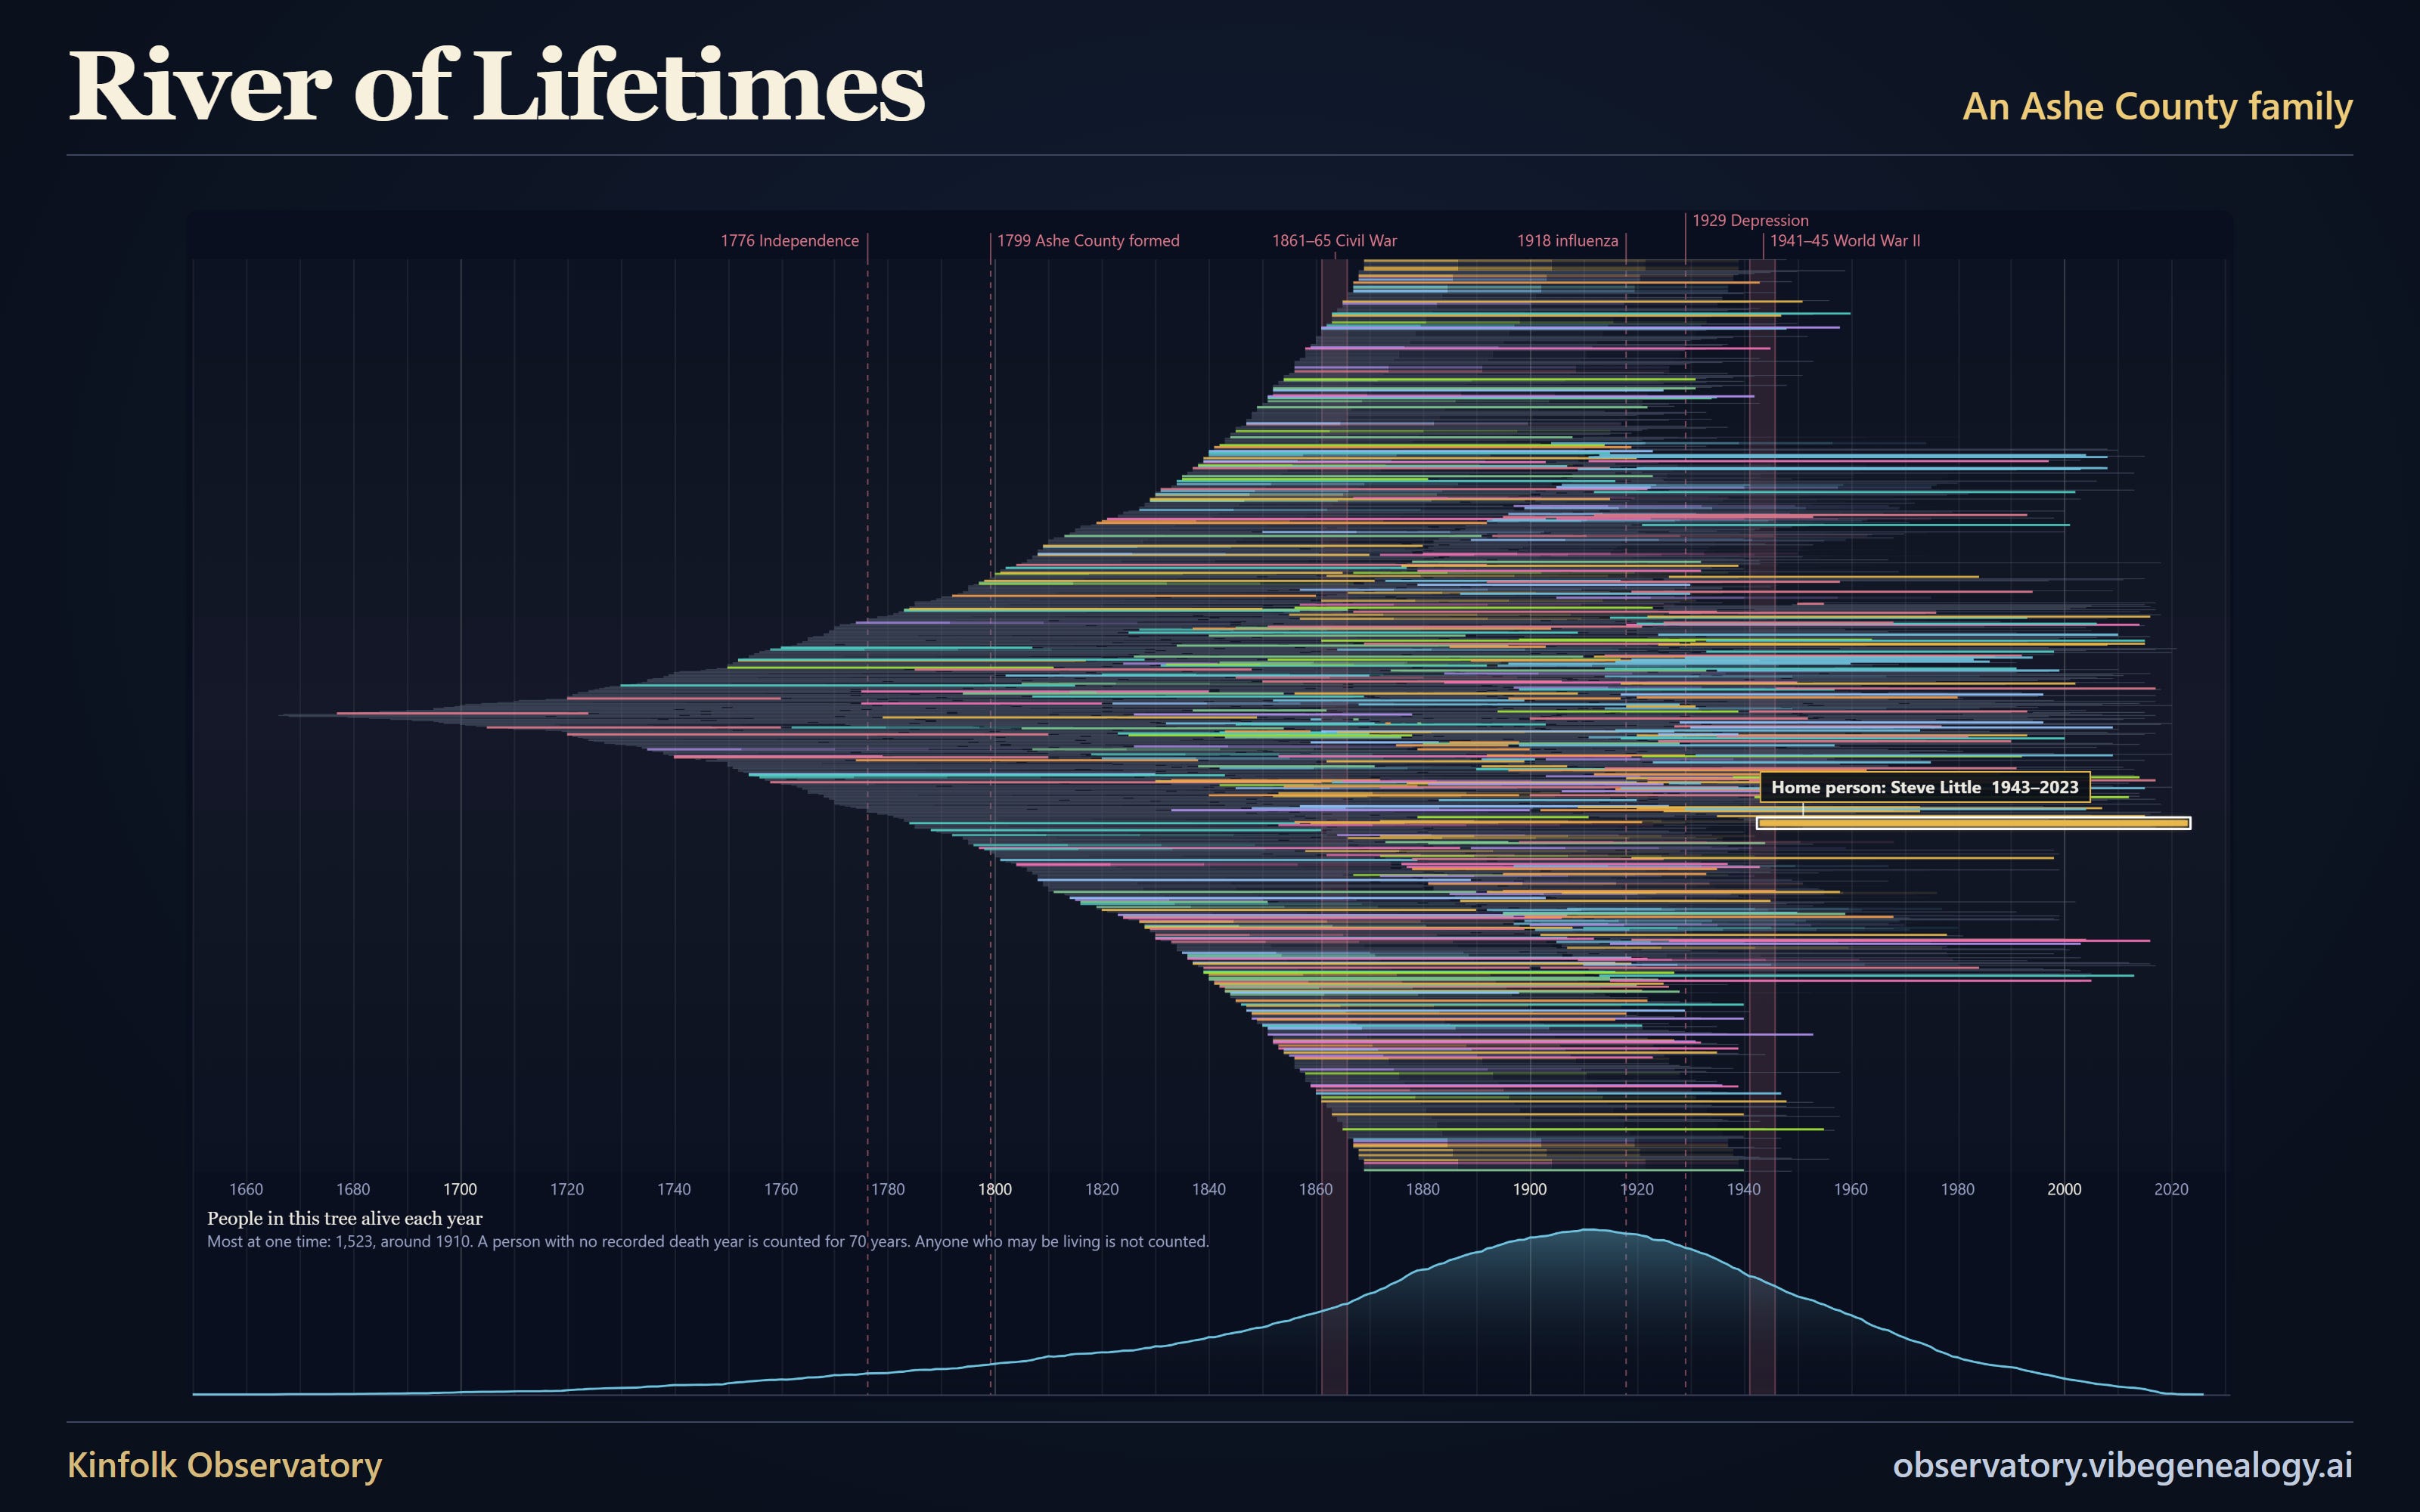
What it shows. Time runs left to right. Every person with a recorded birth year is one thin line, from birth to death. A line that fades out has no recorded death year. The 697 people with no usable birth year are left out, including anyone who may be living. Color the lines by surname, by birthplace, or by how each person is related to the home person. A curve along the bottom estimates how many people in the tree were alive at the same time.
In my family. Here the colors are surnames. The curve peaks around 1910, at about 1,523 people alive at once, counting 70 years where no death is recorded. The marked years include 1799, when Ashe County was formed.
6. The Tangle
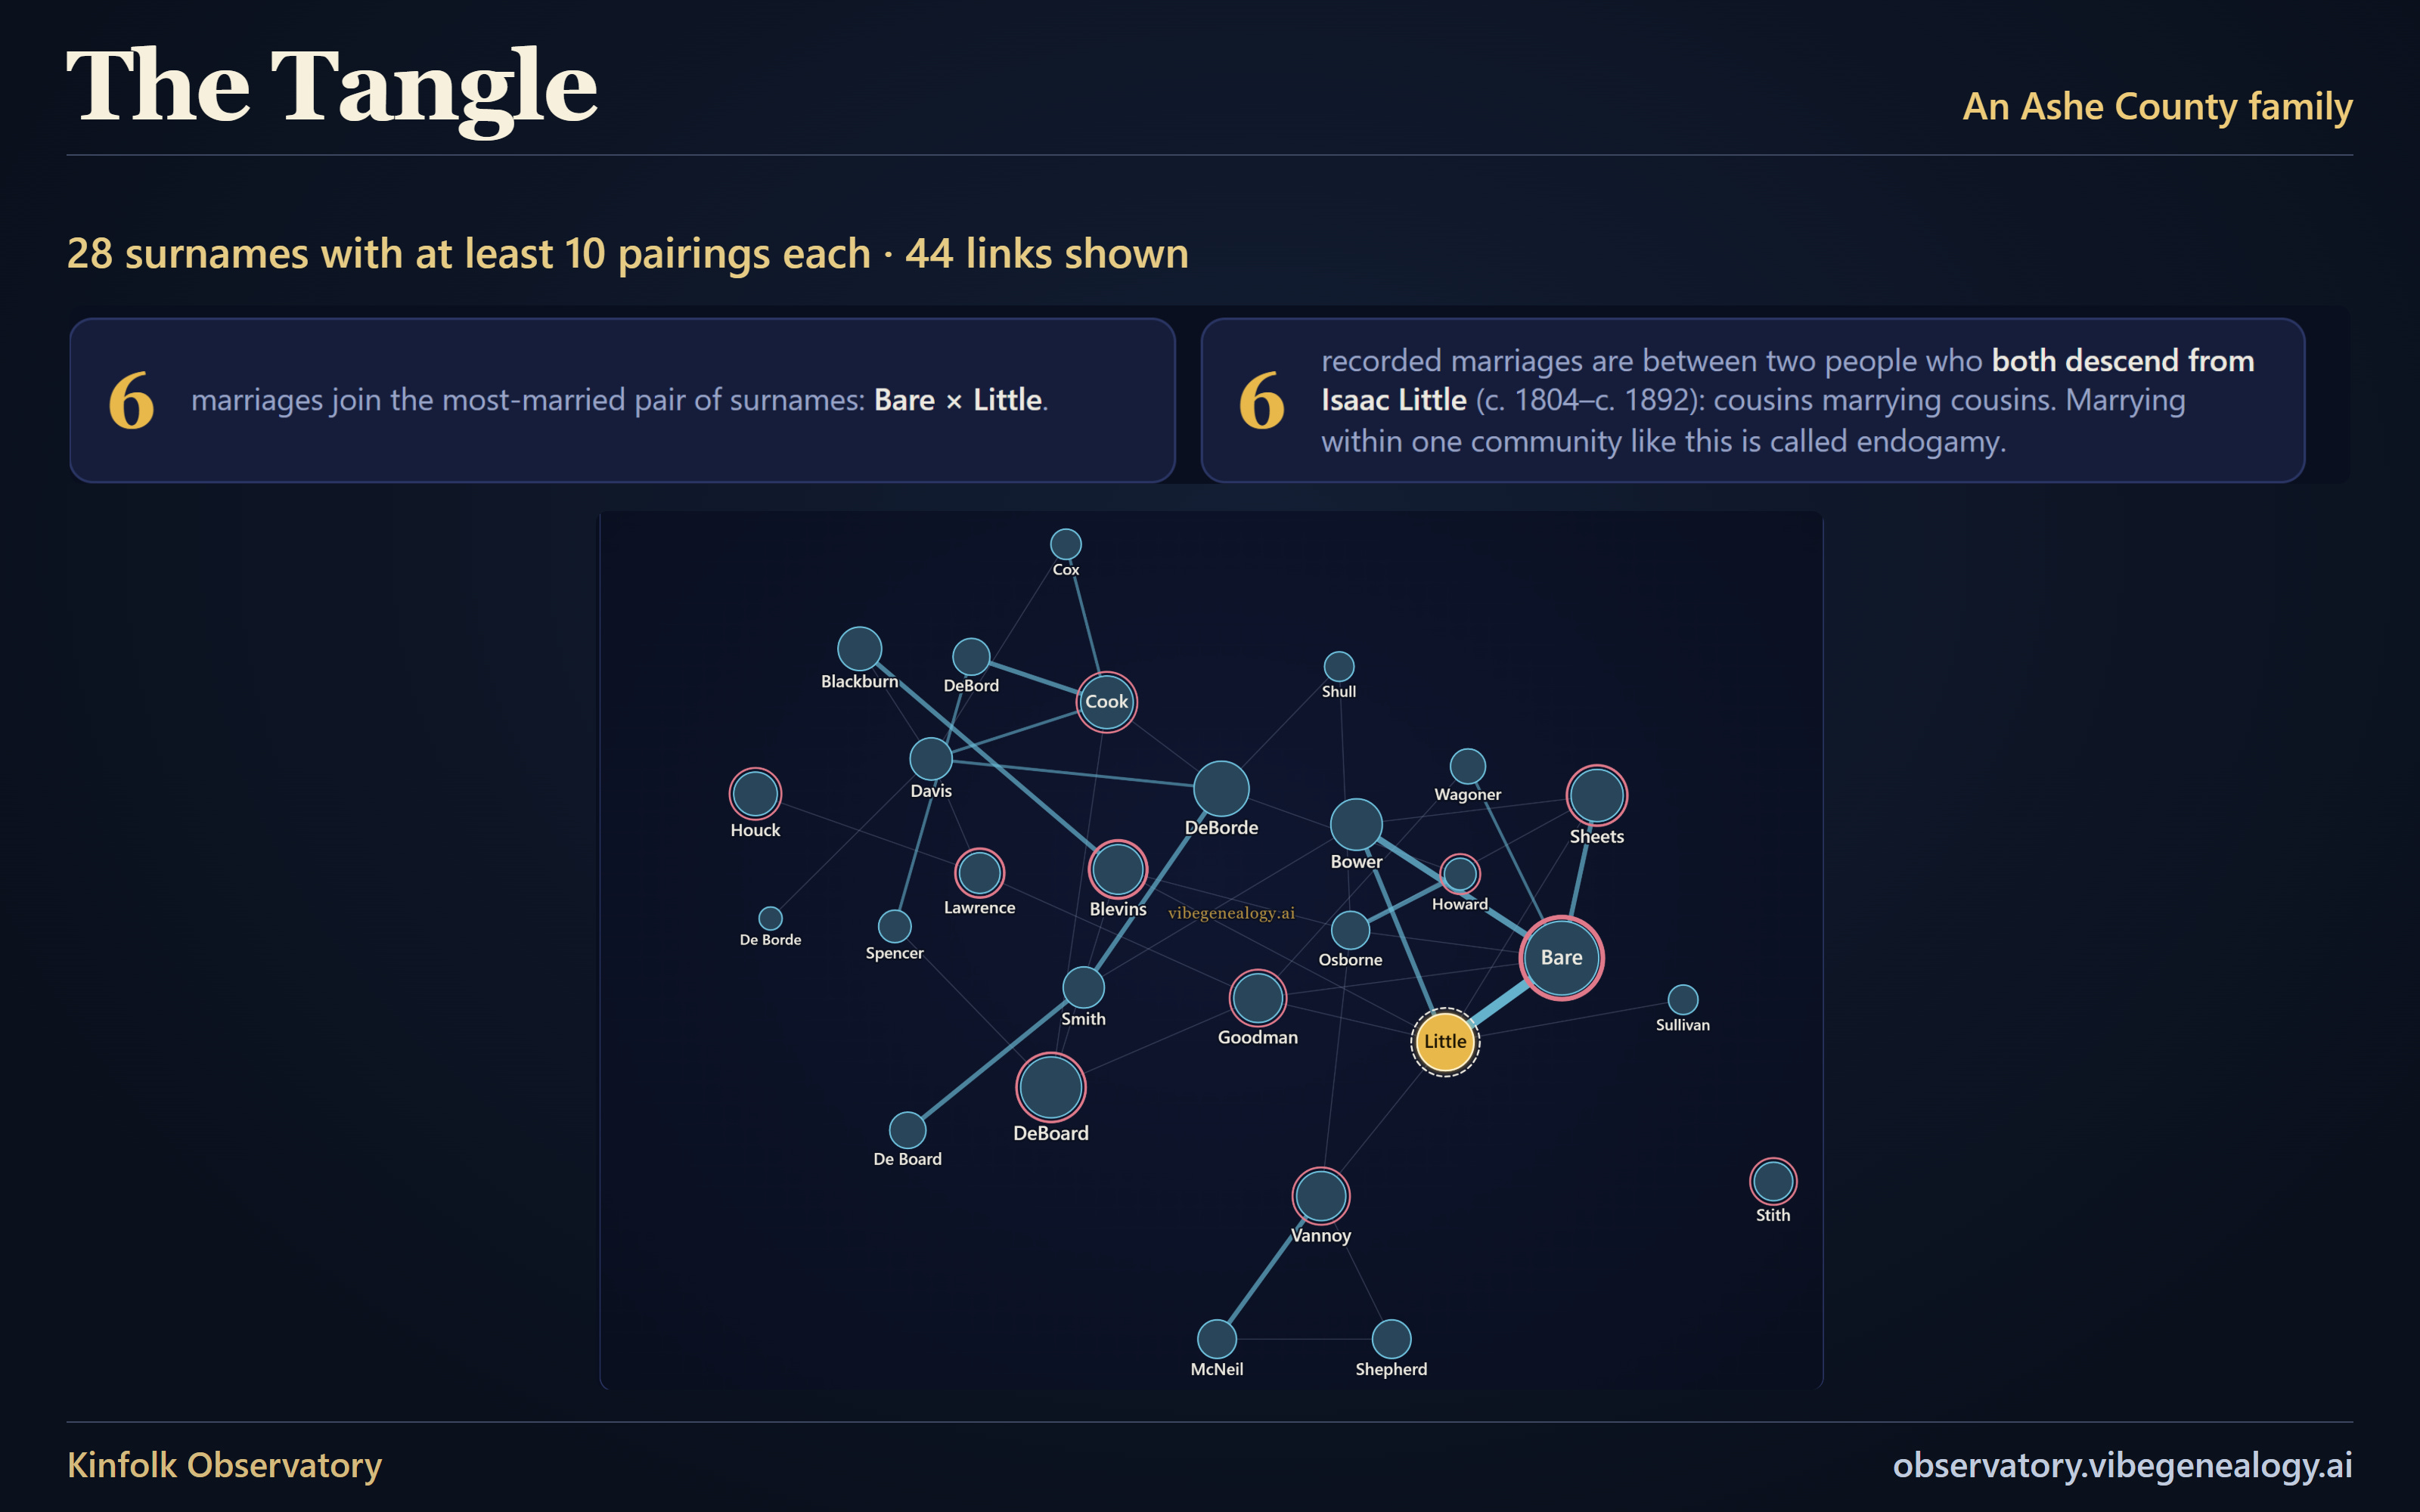
What it shows. A bigger circle means more people with that surname. A thicker line means the same two surnames paired up again and again. Click a circle to list the couples. This picture shows the 28 surnames with at least 10 recorded couples, out of 597 in the tree.
In my family. Across the whole tree, 53 pairs of surnames are joined more than once. The tree records 6 Bare and Little couples. Separately, it records 6 couples in which both partners descend from Isaac Little. When people tend to marry within the same community over generations, it is called endogamy. In a small mountain county where neighbors stayed neighbors, that was ordinary.
7. How Are We Related?
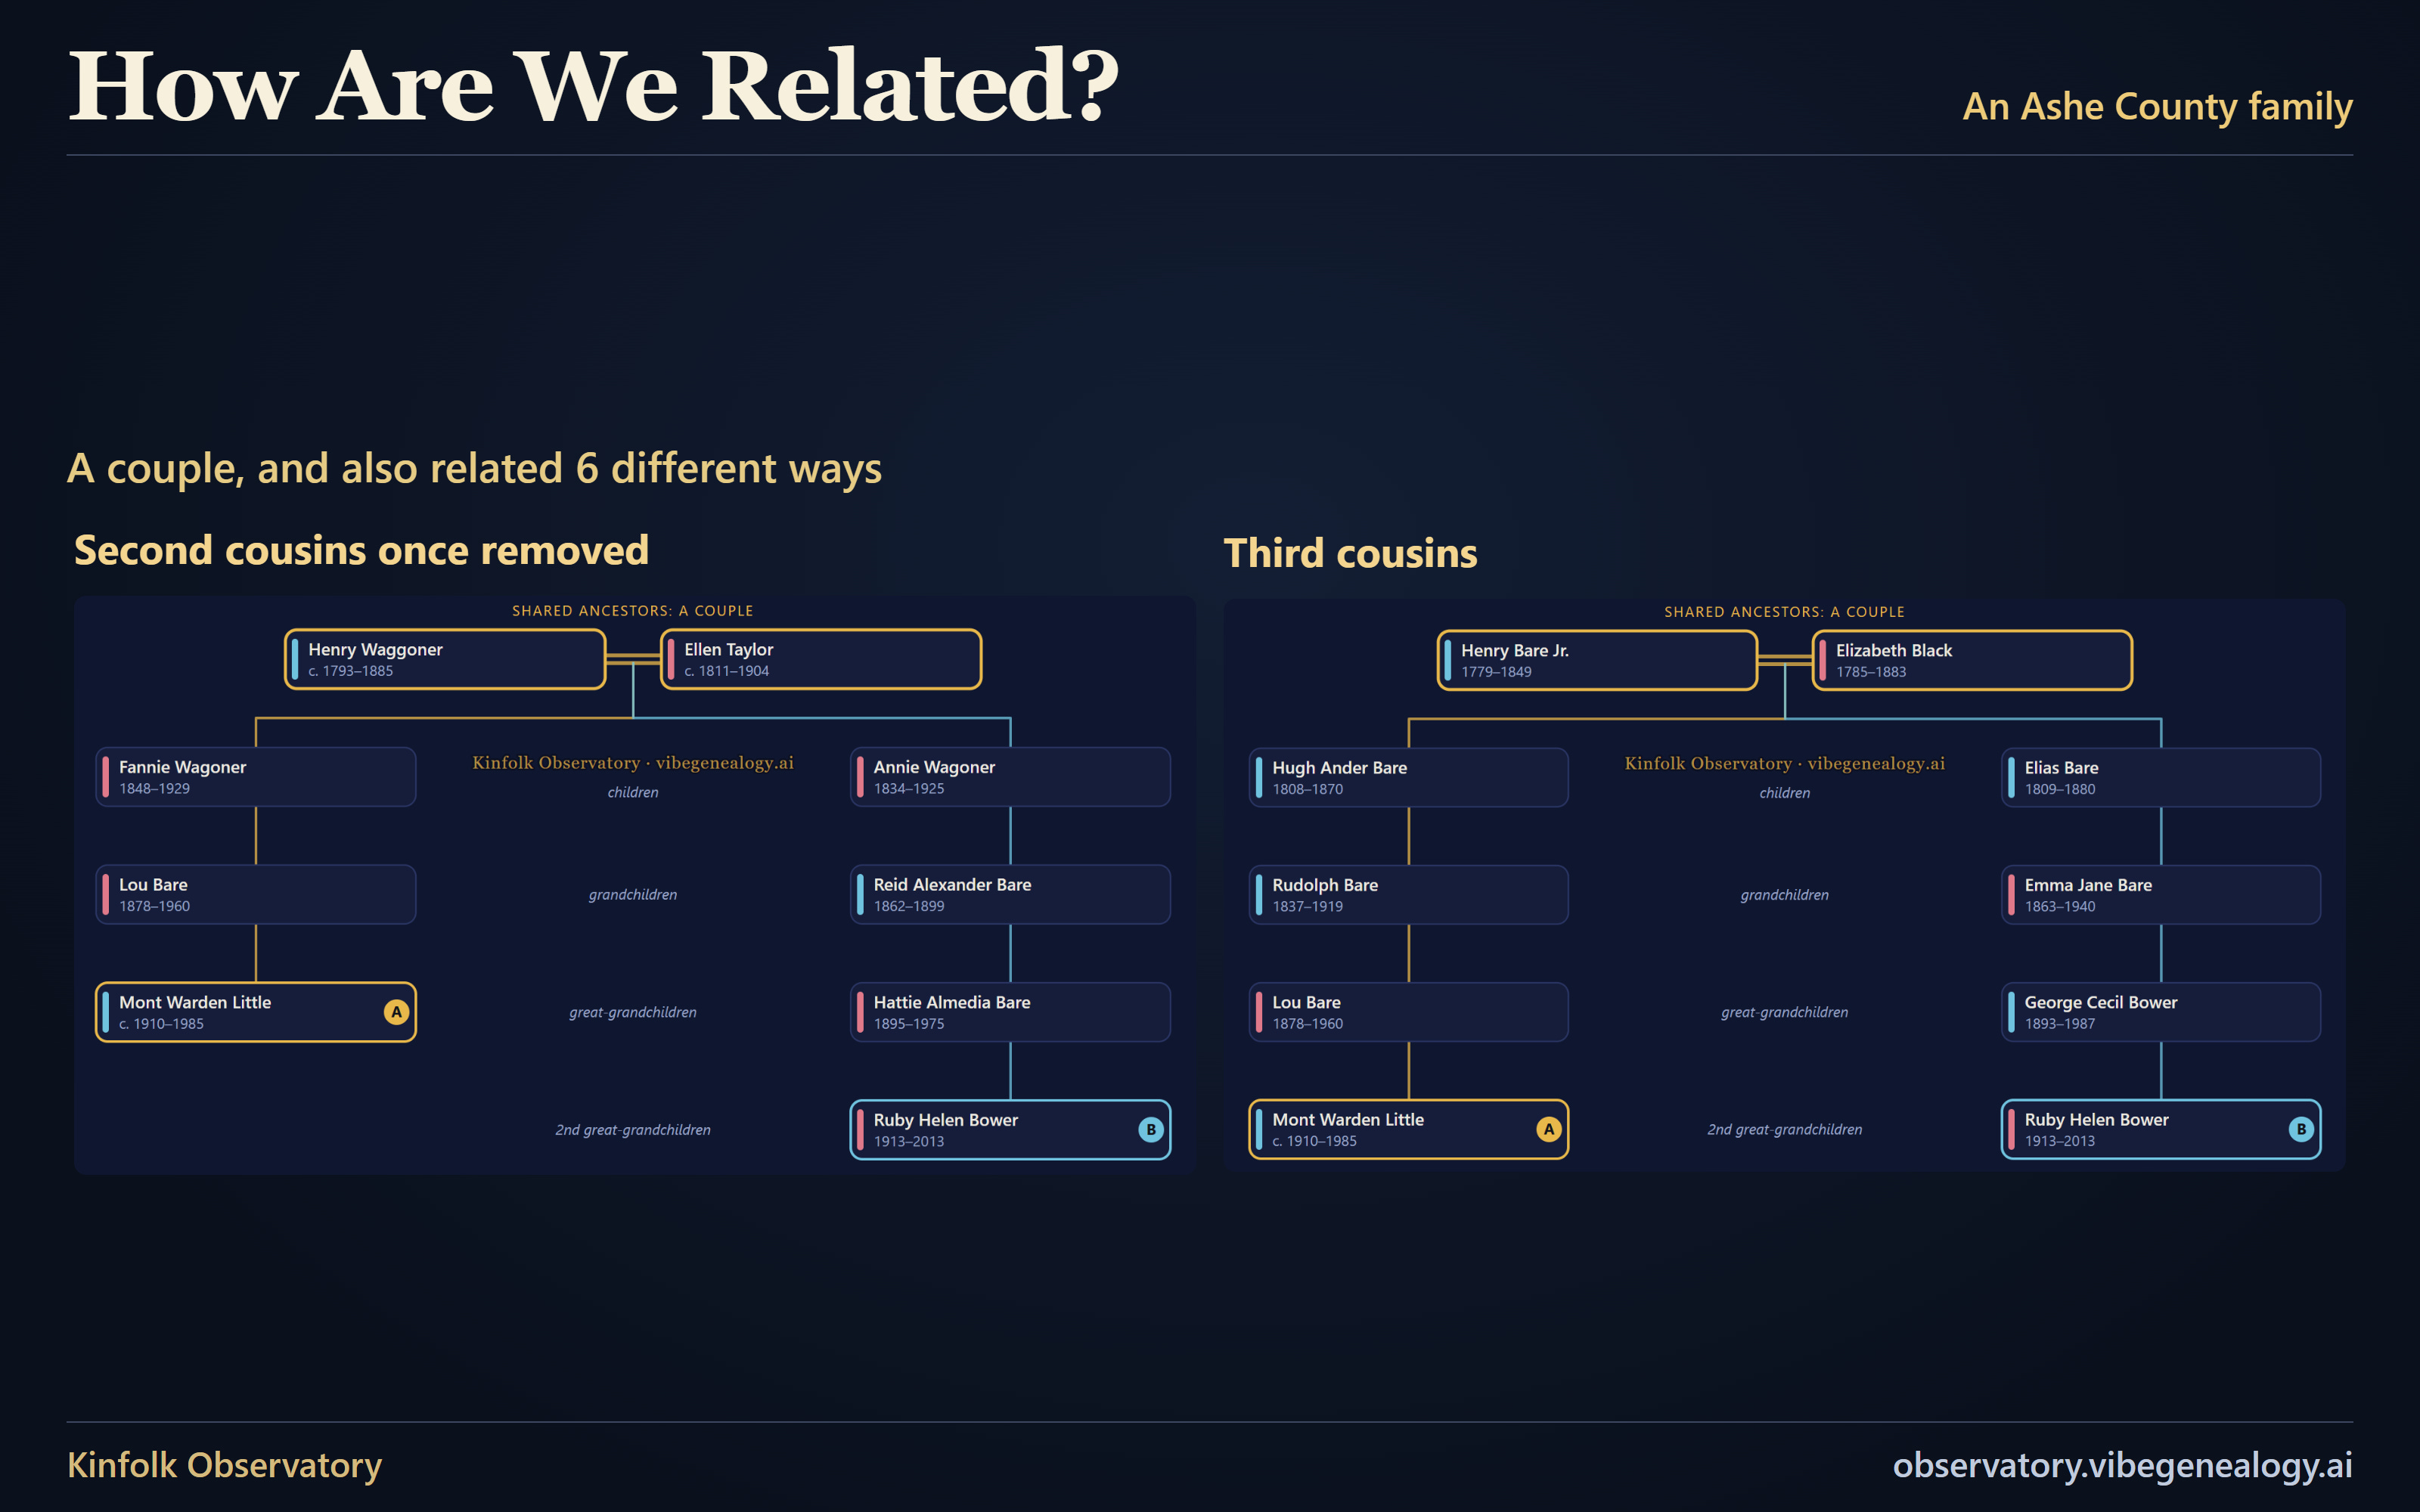
What it shows. Choose two people. The page finds the closest relationships between them, names each one in plain words, and draws each line back to the ancestors they share. Surprise me picks a pair for you.
In my family. I chose my father’s parents, Mont Warden Little and Ruby Helen Bower. The page’s answer: “A couple, and also related 6 different ways.” The picture shows two of the six. Through Henry Waggoner and Ellen Taylor, the tree records them as second cousins once removed, which means one was a second cousin of the other’s parent. Through Henry Bare Jr. and Elizabeth Black, it records them as third cousins.
8. Life Story
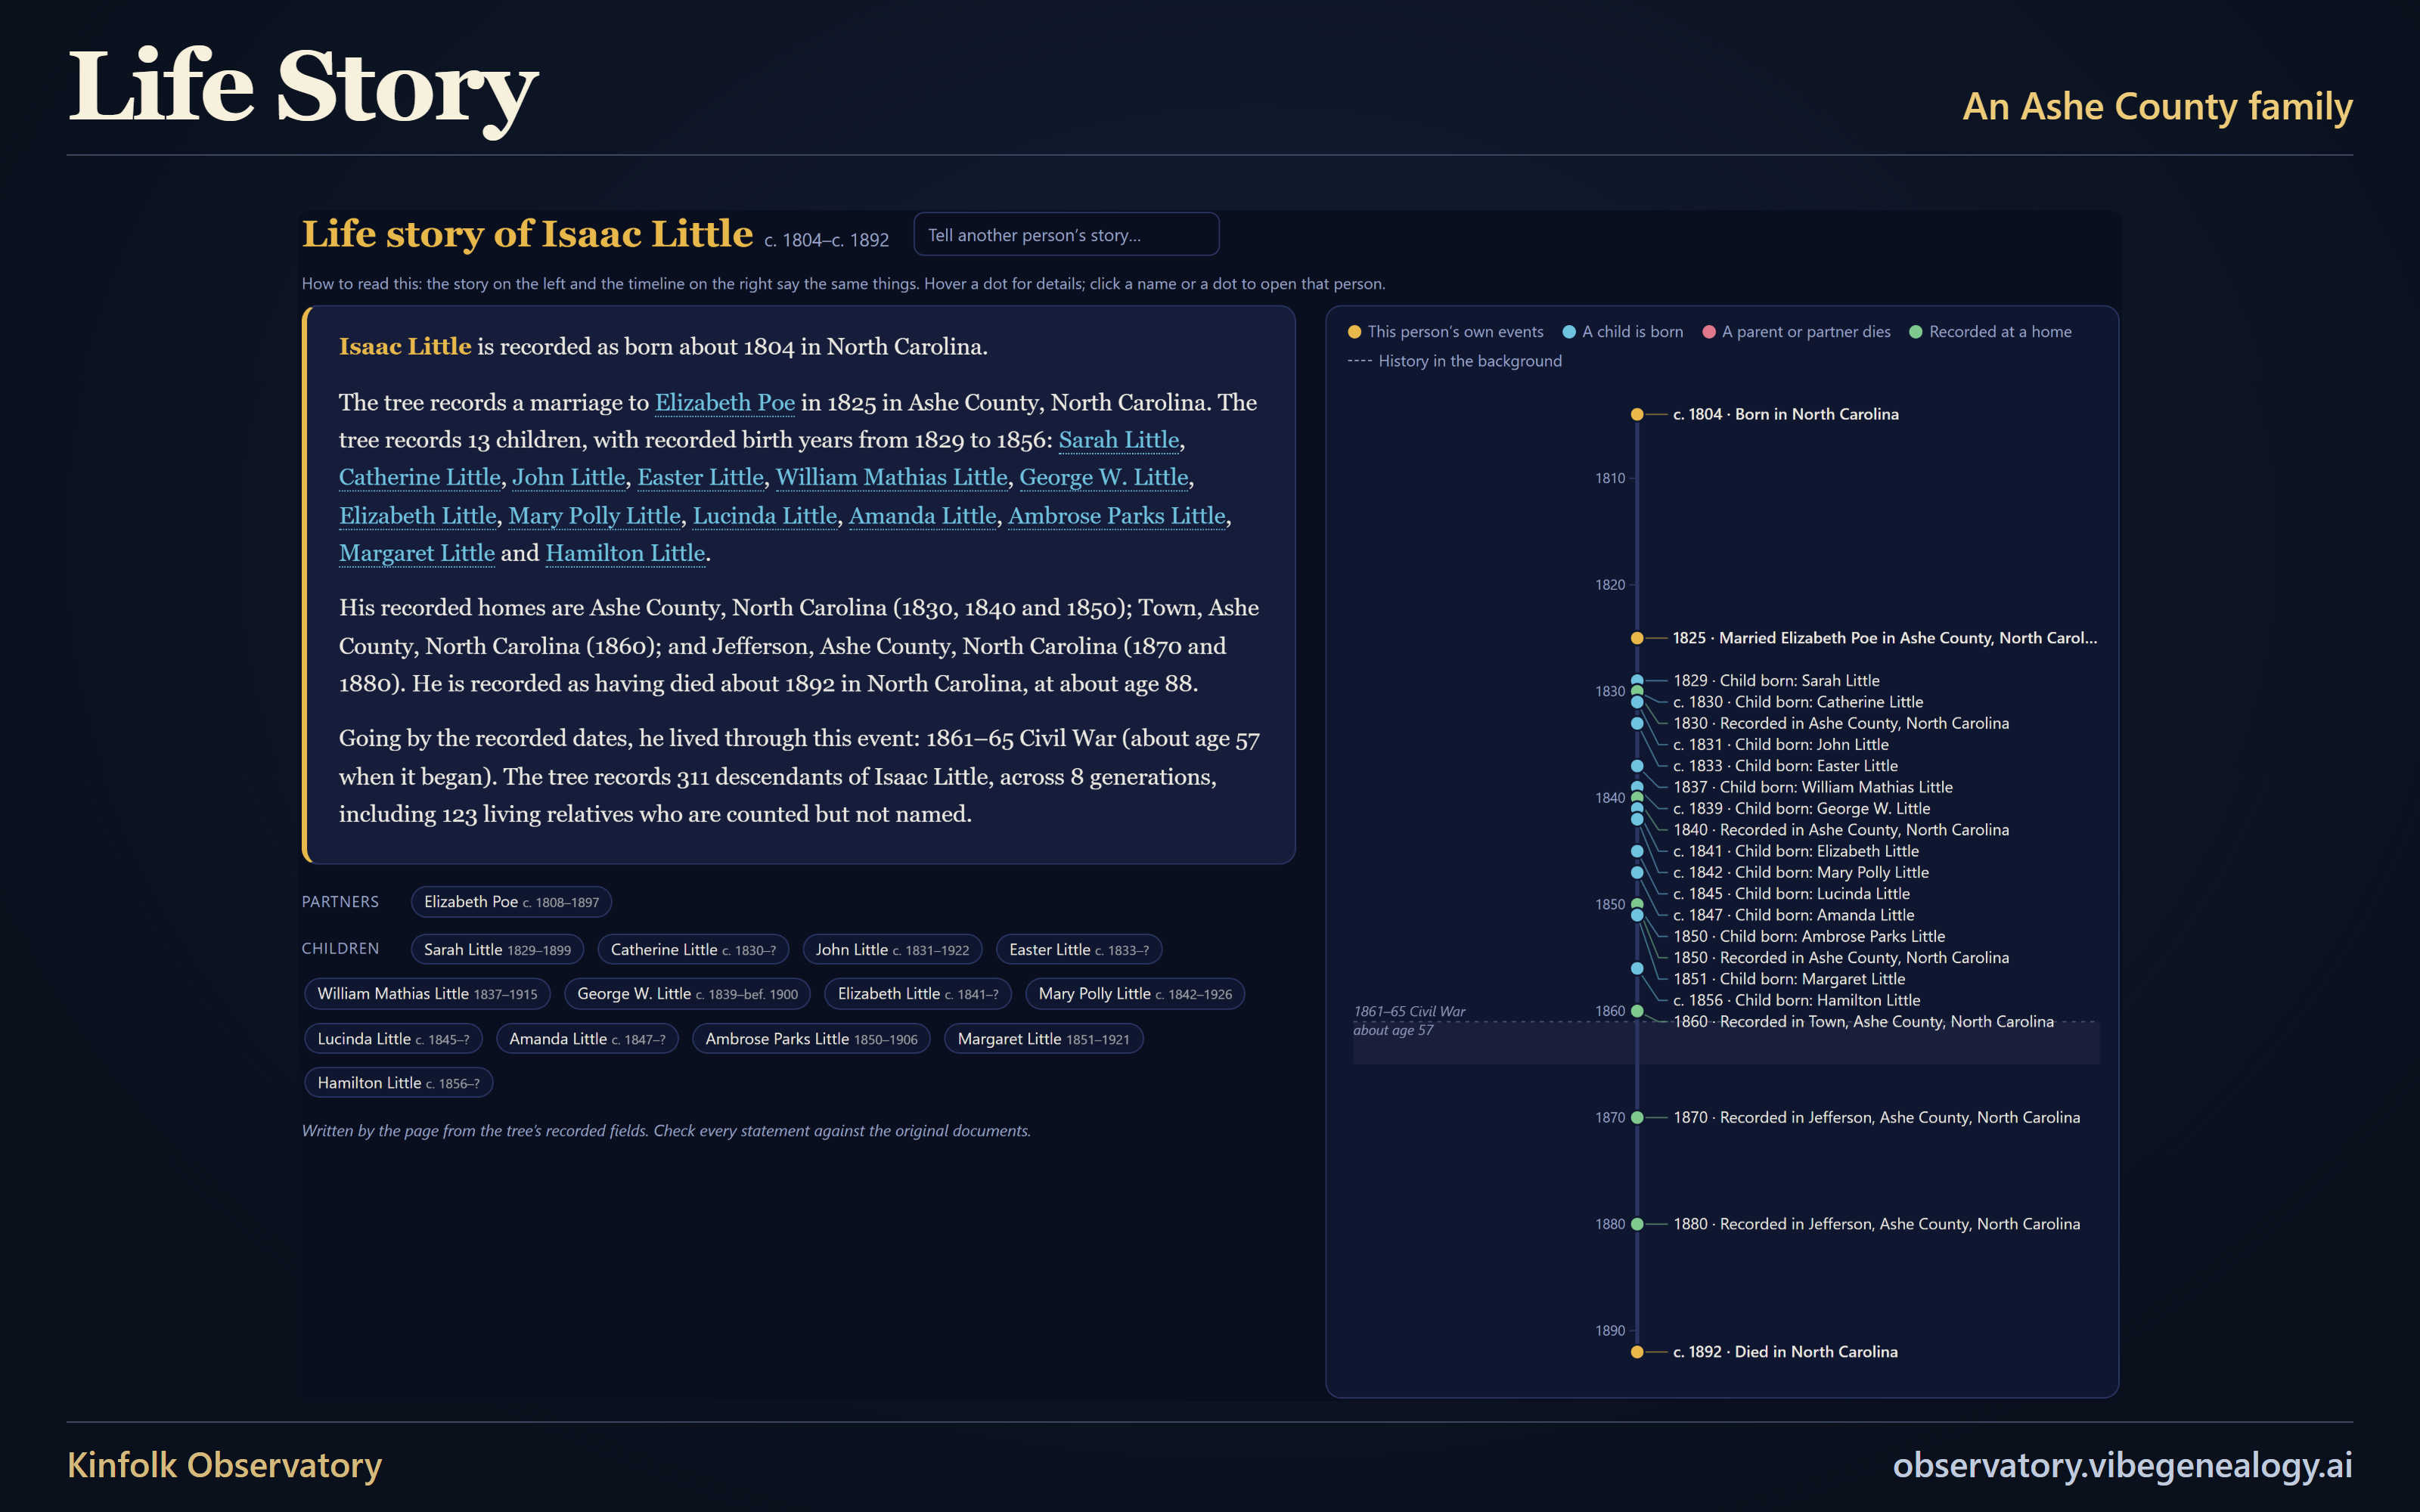
What it shows. Pick a person and the page turns the dates and places in the file into a short story beside a timeline. It covers birth, parents, brothers and sisters, marriages, children, death, and the history they lived through. It says “is recorded as” because a tree holds what someone wrote down, not what is proved.
In my family. This is Isaac Little’s story. The tree records his marriage to Elizabeth Poe in Ashe County in 1825, his 13 children, and his homes from 1830 to 1880.
9. By the Numbers
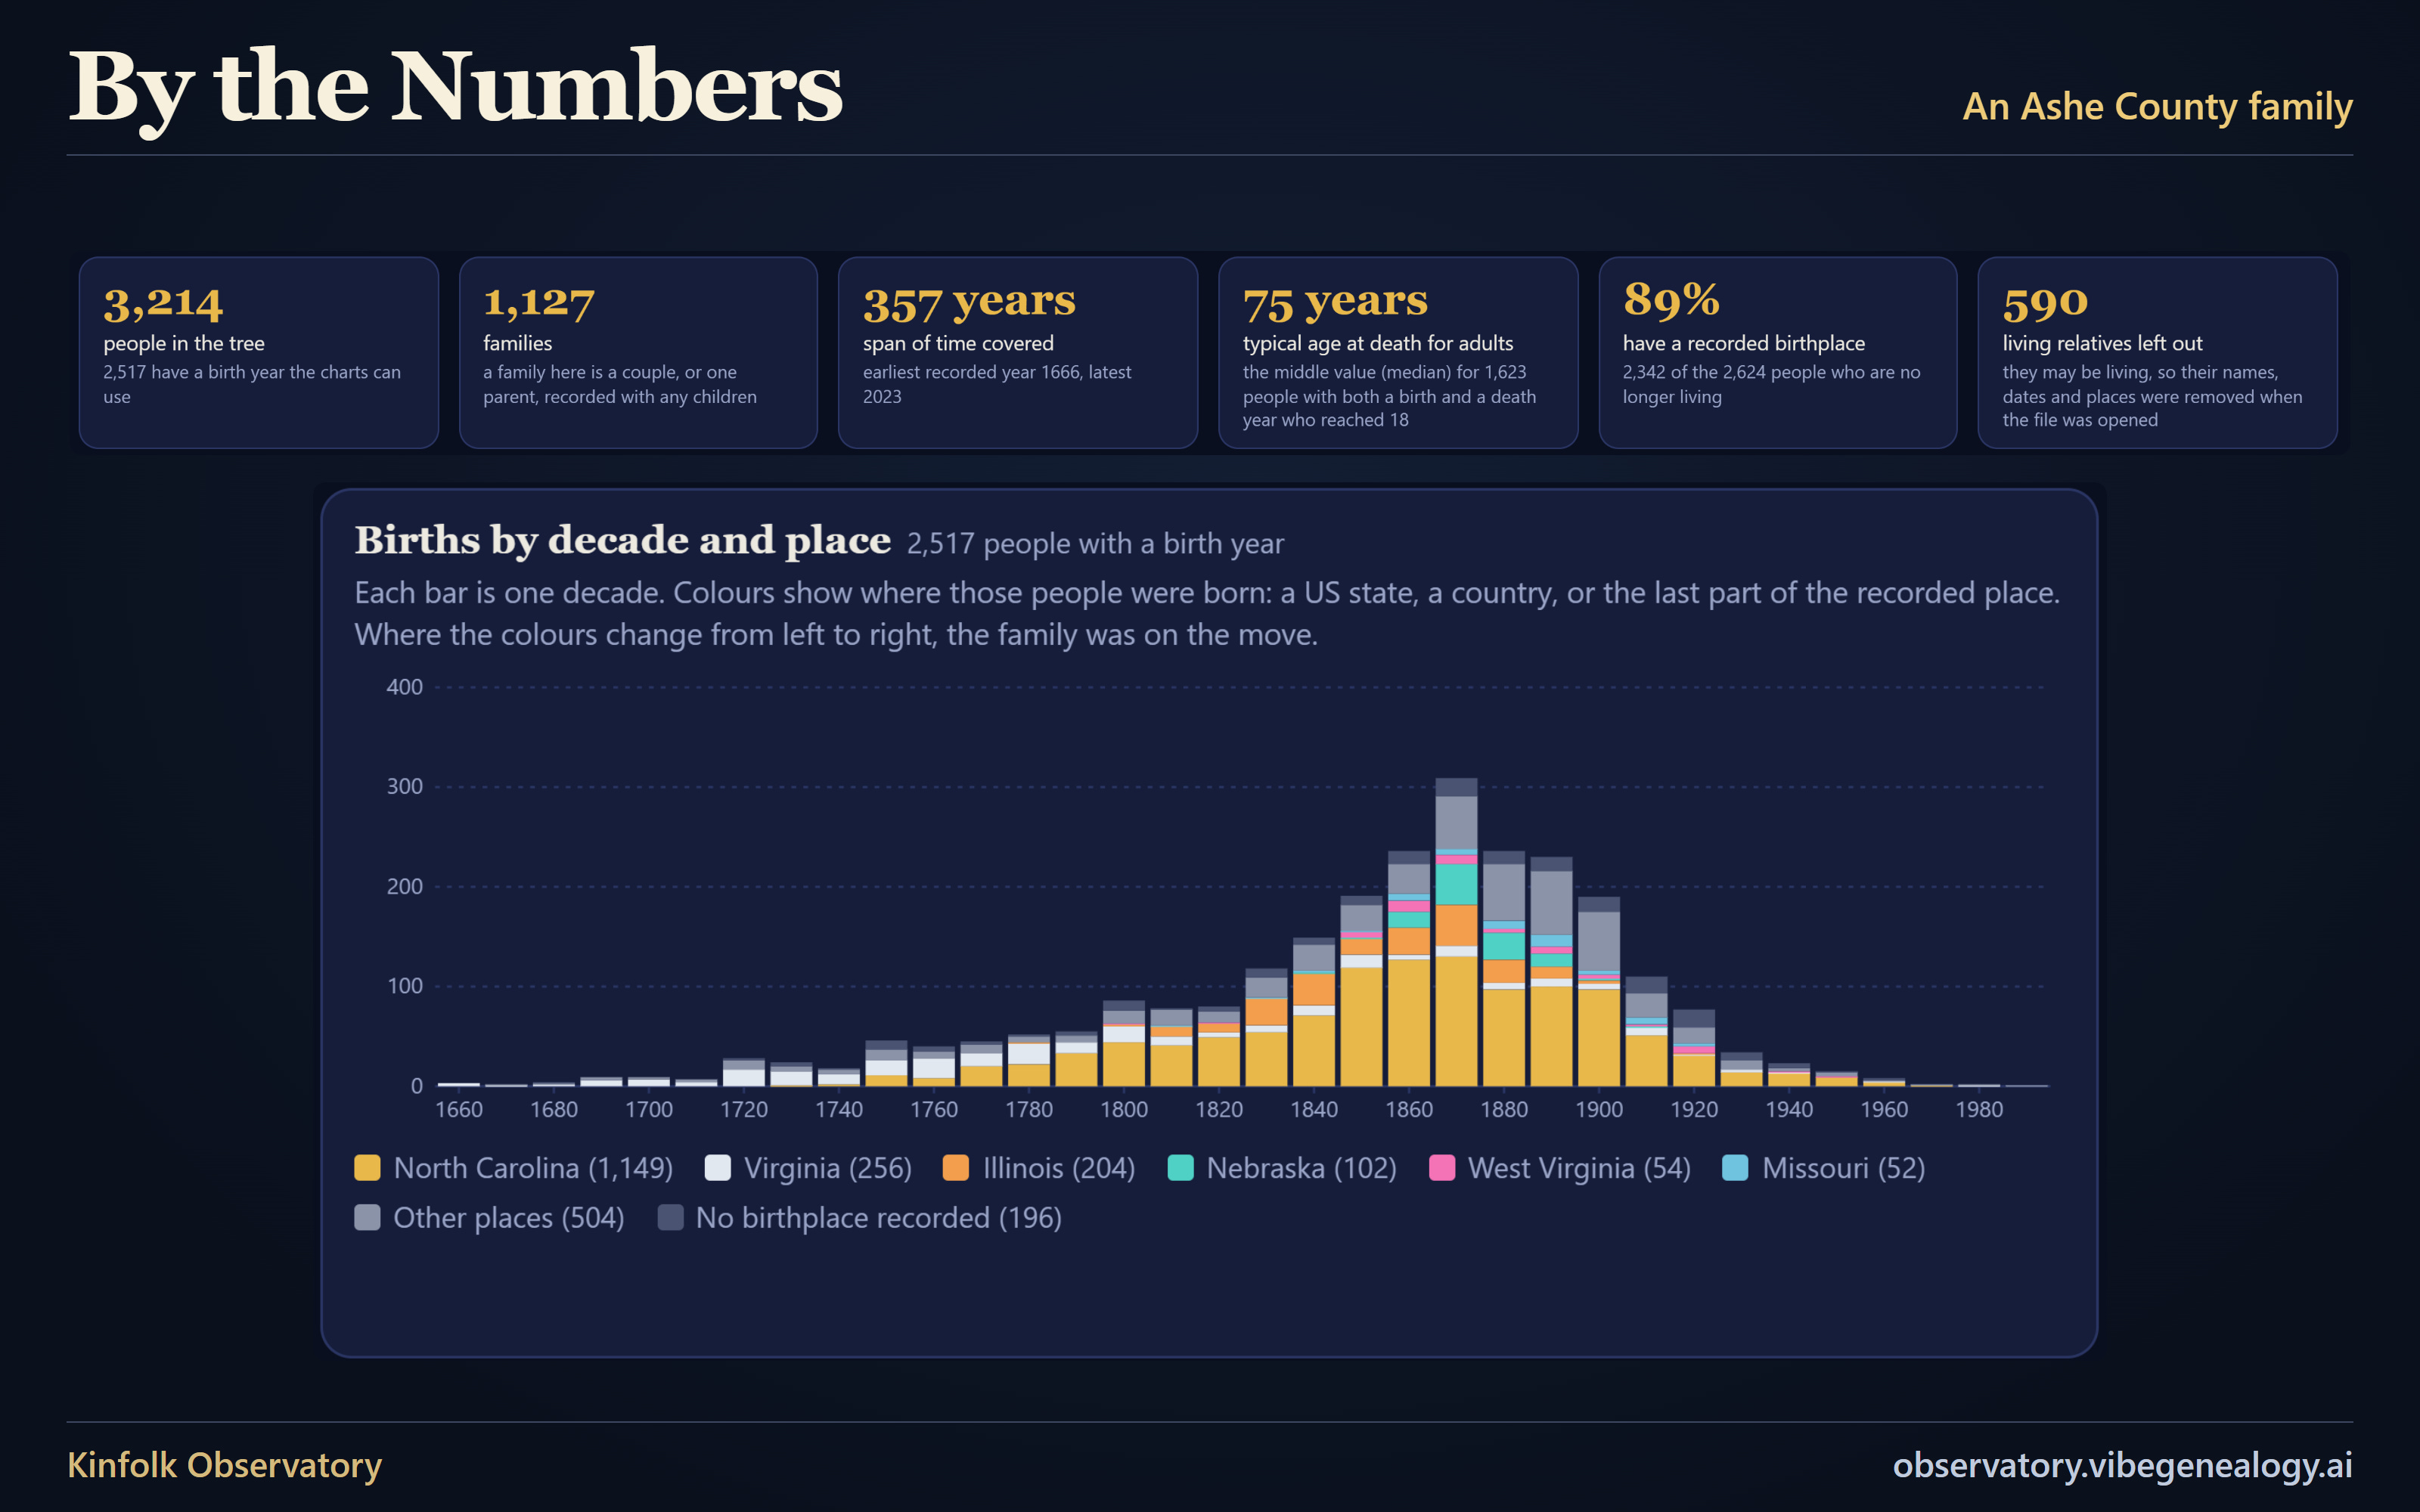
A page of charts drawn from the whole tree: births by decade and place, length of life, family size, common names and more. Every number counts what the tree records, not a proven fact about the past. In mine, among the 1,623 people with both years recorded who reached 18, the middle age at death was 75.
10. Descendants
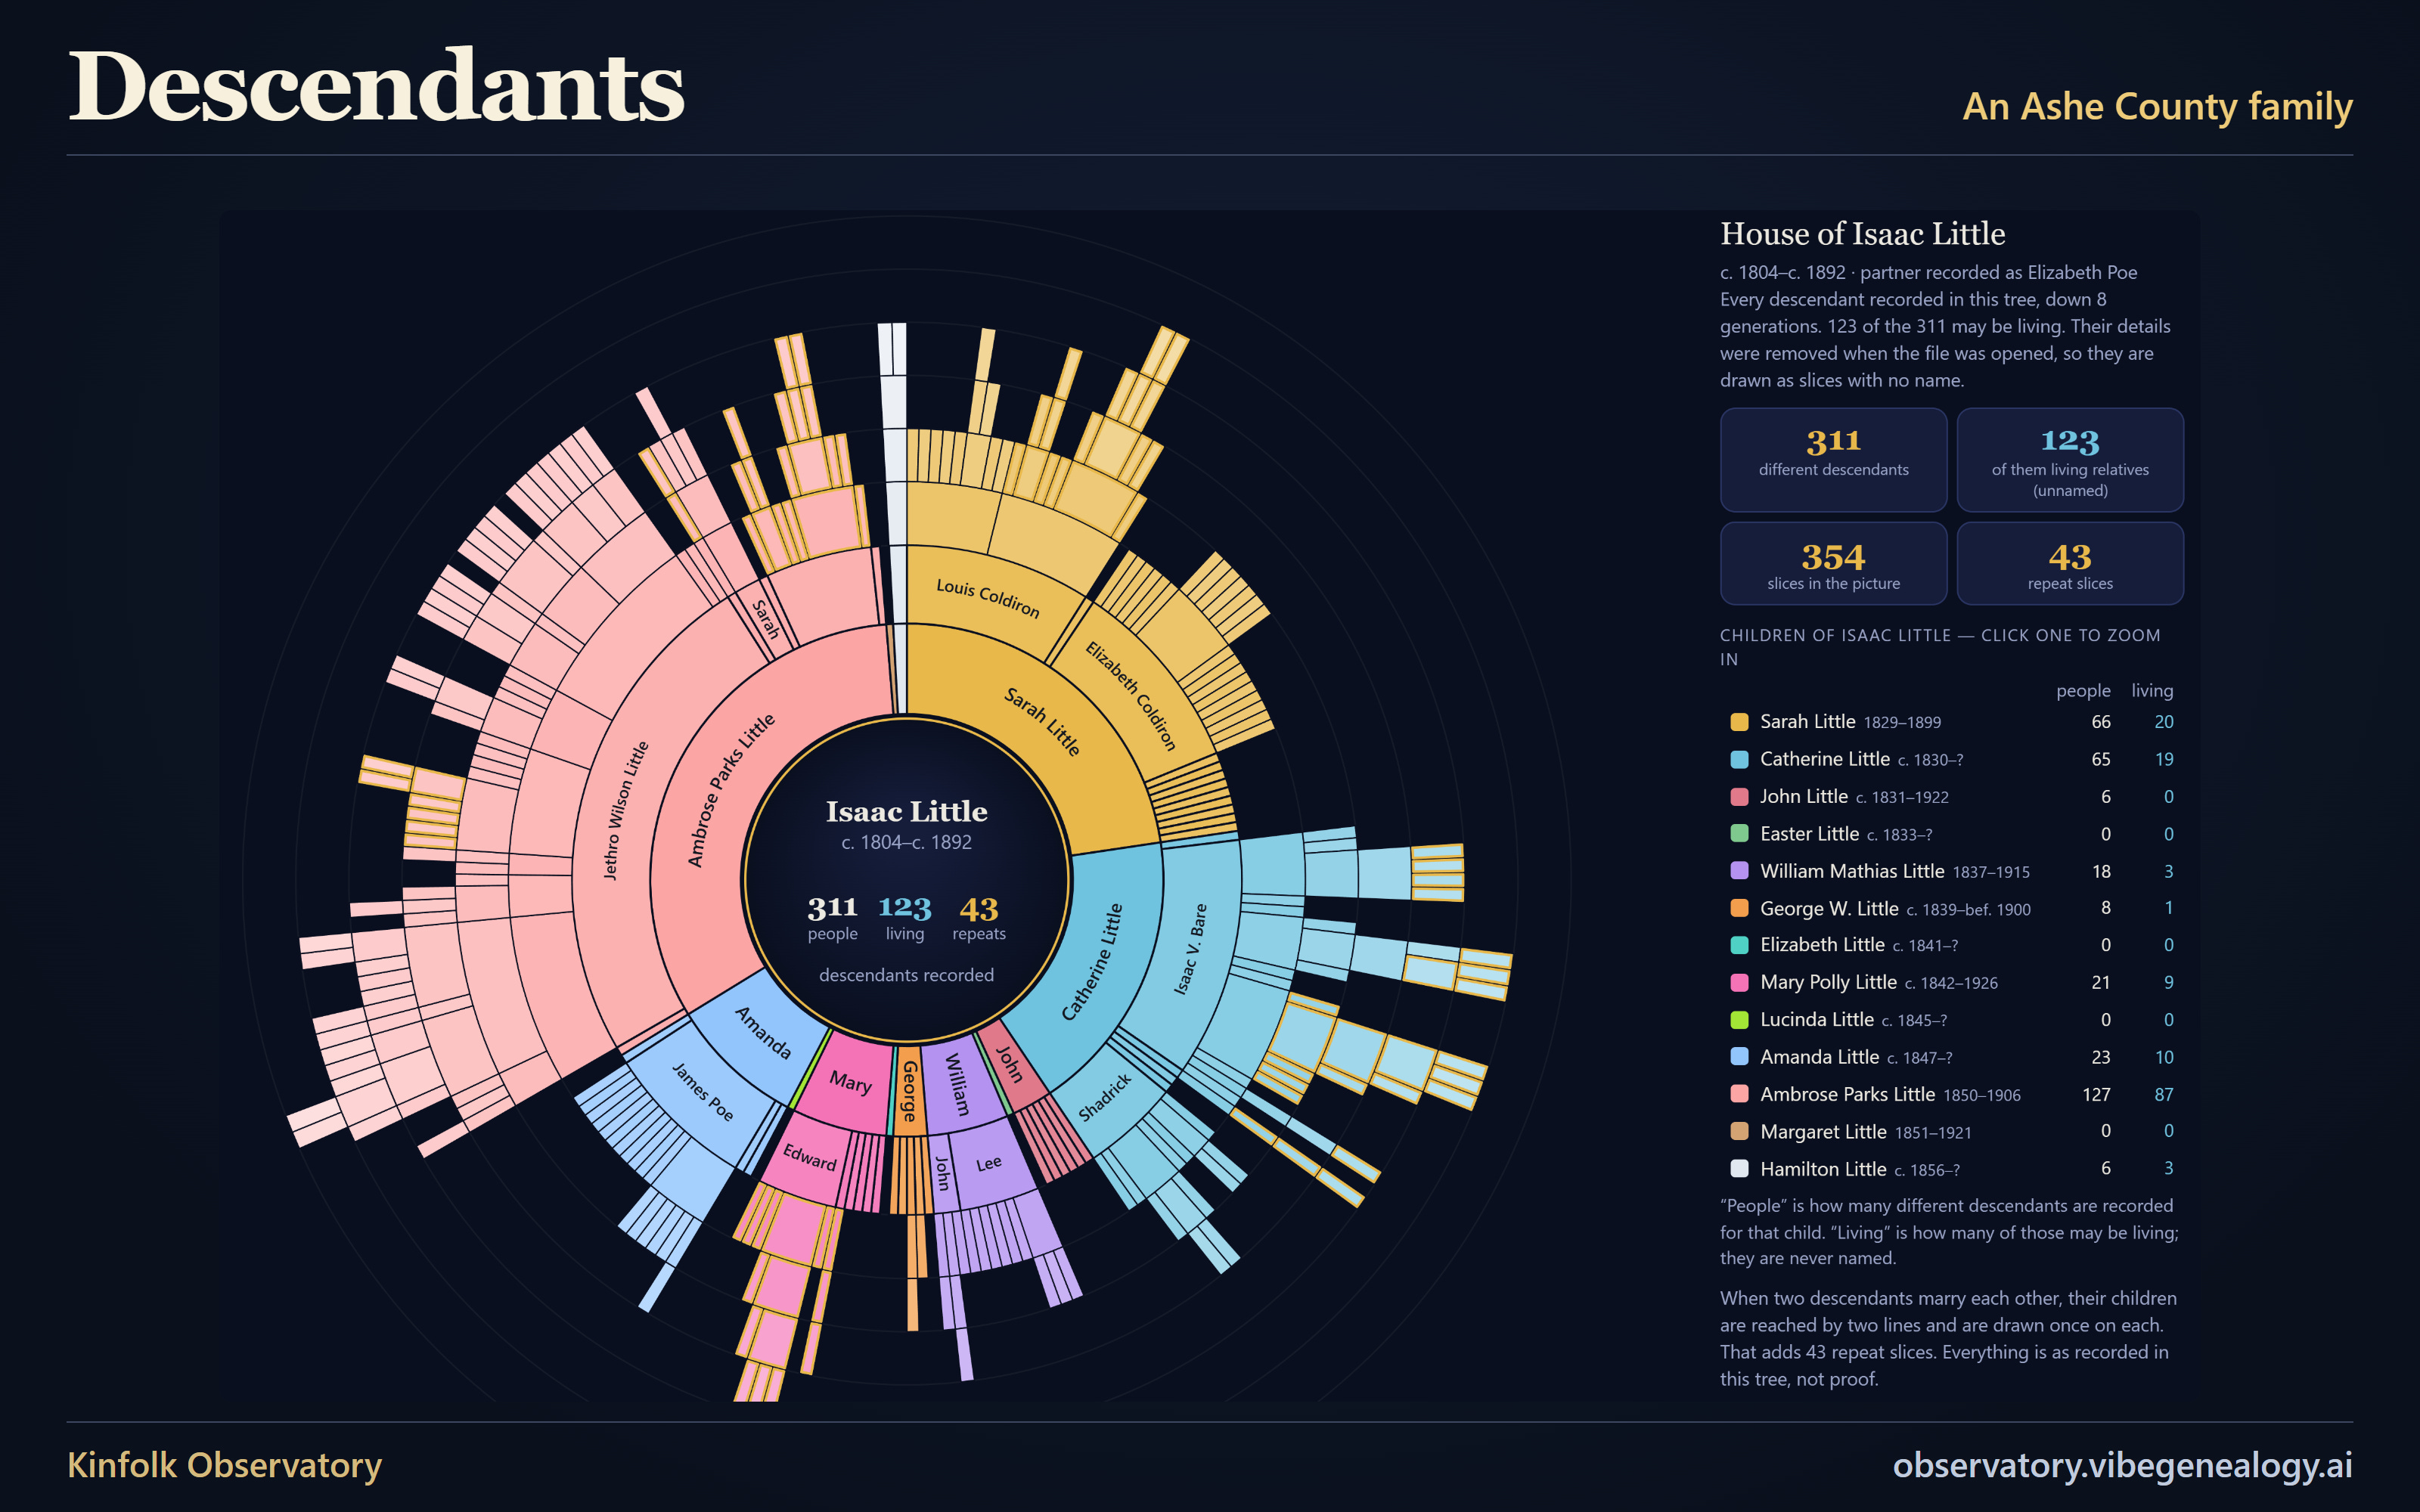
What it shows. Start from any person. Each ring outward is one generation later, and a wider slice means more descendants. Each child of the starting person gets a color. A gold edge marks someone who appears in more than one place, because two descendants married each other.
In my family. Isaac Little has 311 different recorded descendants here, through 13 recorded children. (123 of them may be living and are not named.) The largest branch is his son Ambrose Parks Little’s, which is my own line. 43 slices are repeats: extra places where the same people appear along more than one recorded line from Isaac. Isaac’s own parents are left out on purpose. That link is not proved, and it is the puzzle I am still working on.
11. Where They Lived
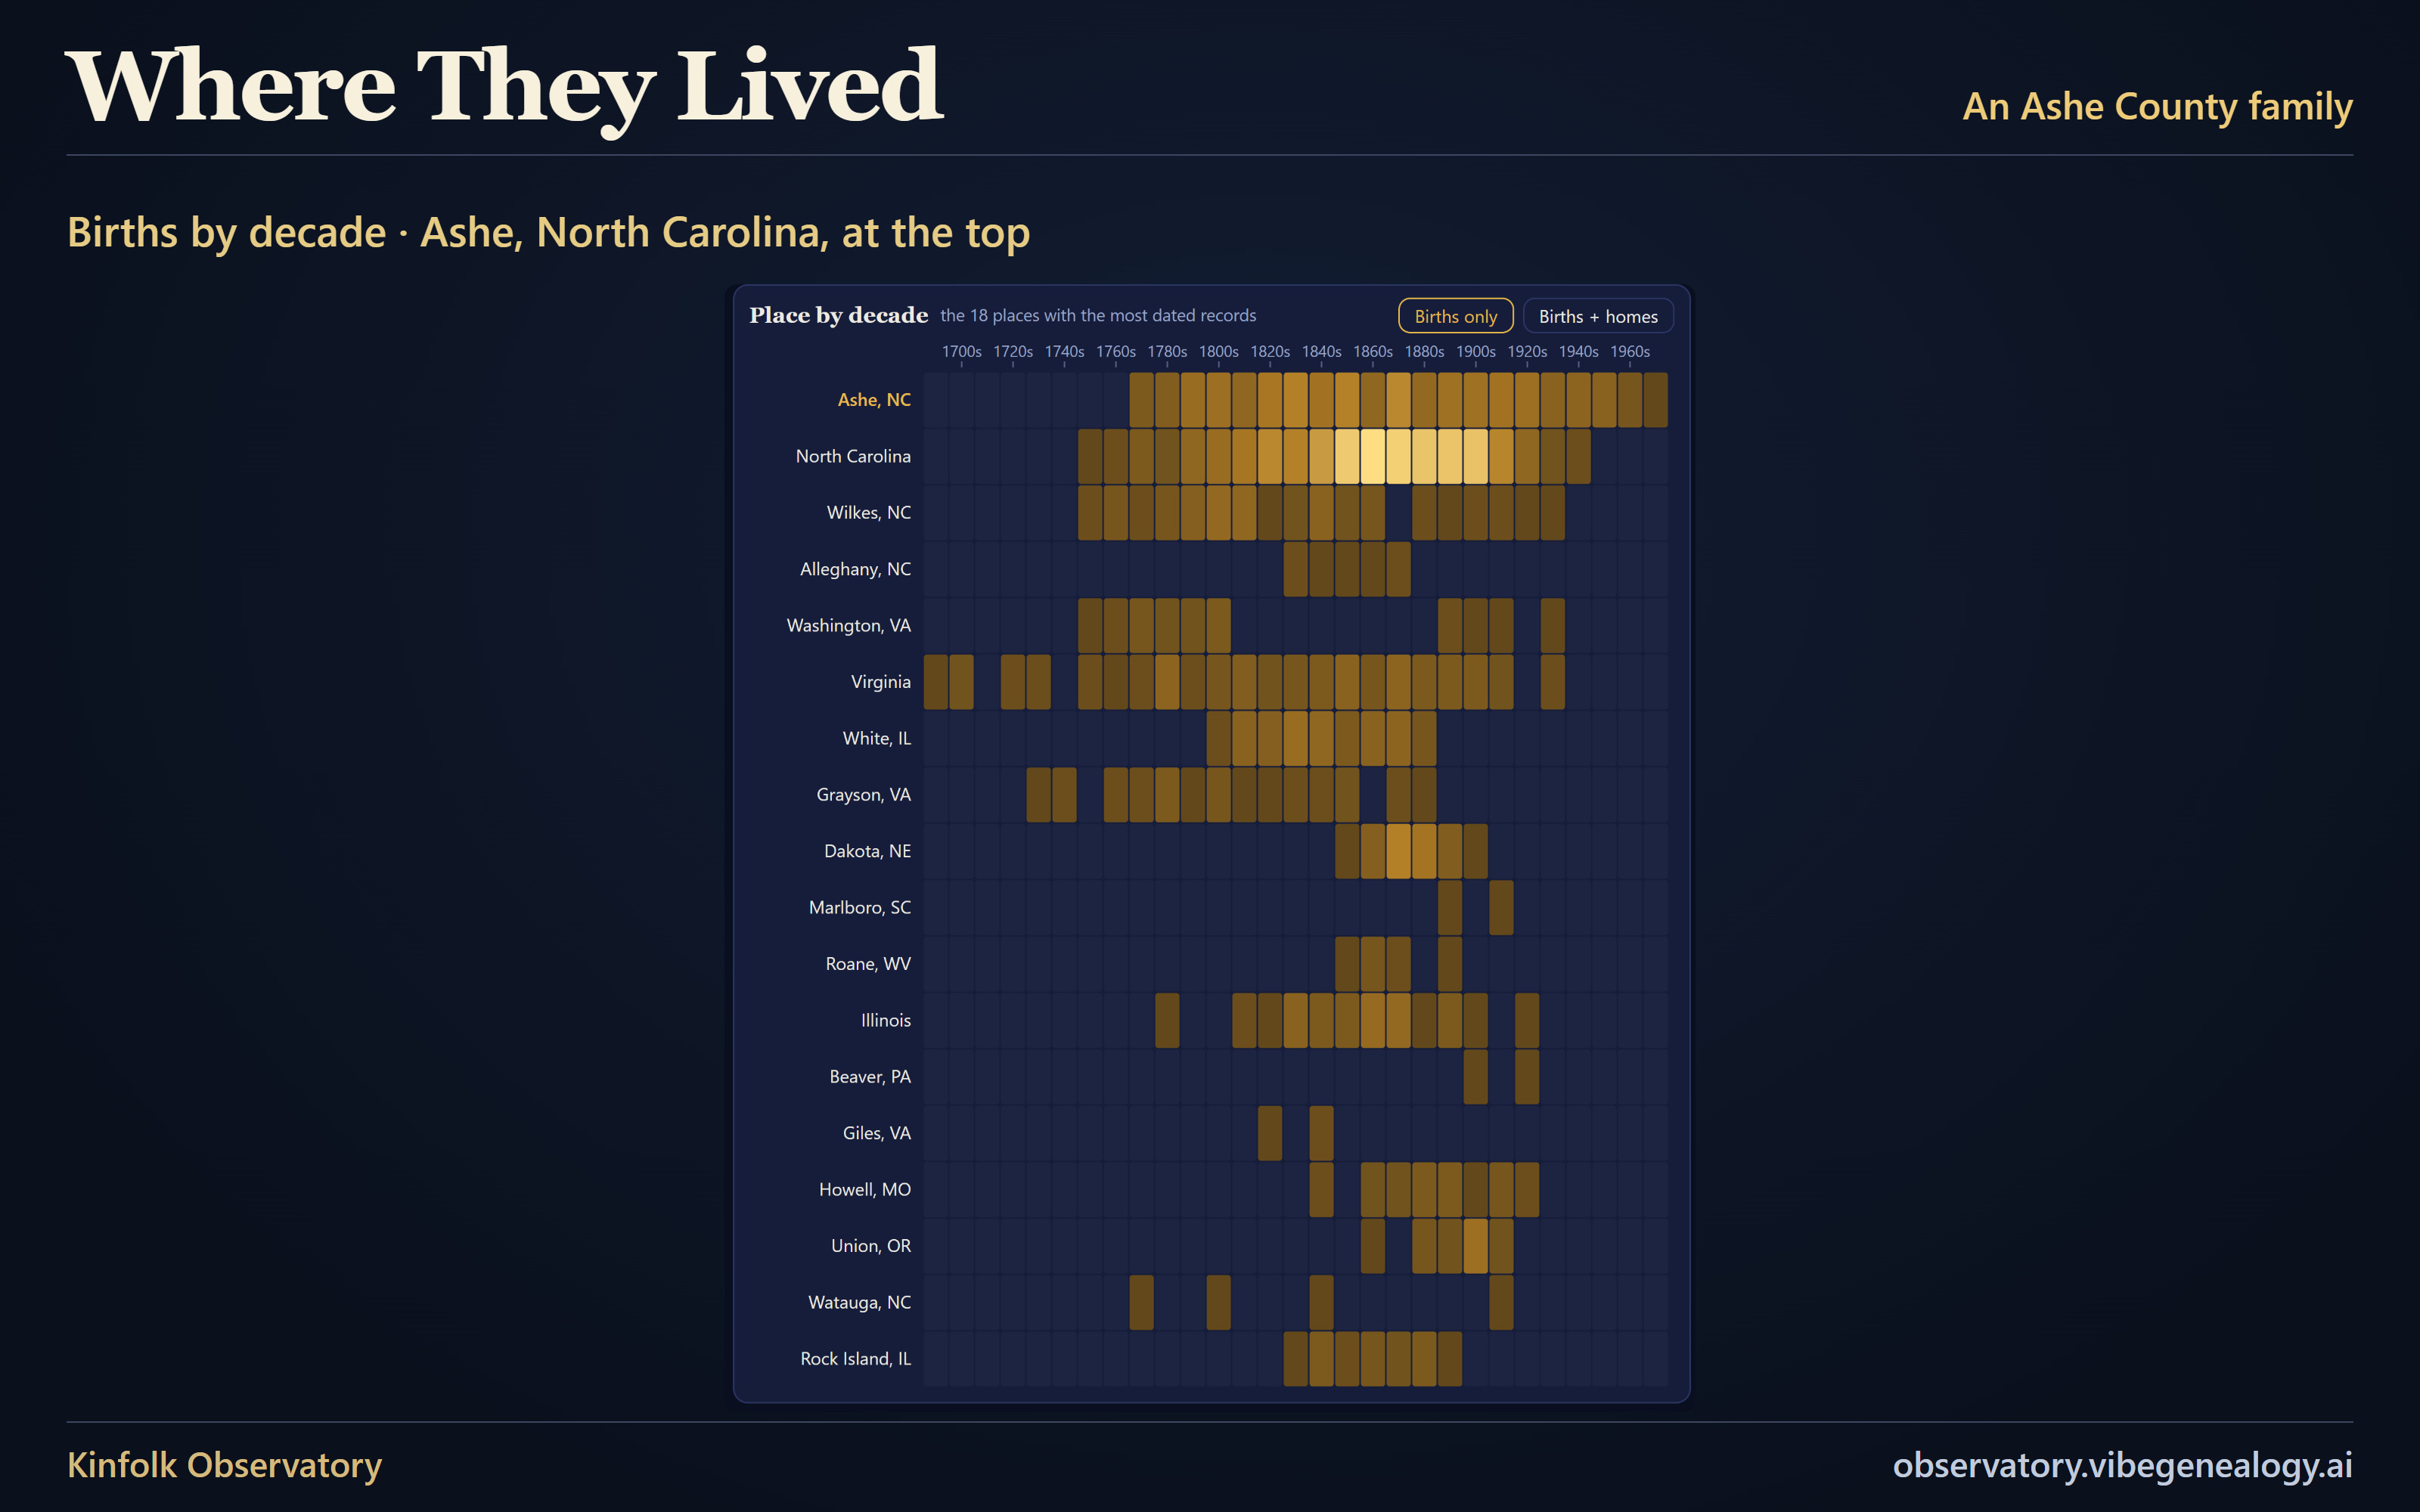
Every row is a place and every column is a decade; a brighter square means more people recorded as born there in those ten years. Ashe County is the most common county of birth in my tree, and half of the recorded births with a known state or country are in North Carolina. Other rows carry the family on to Illinois, Nebraska, Missouri and beyond. The same view can also draw ribbons from each parent’s birthplace to each child’s.
12. Things Worth Checking
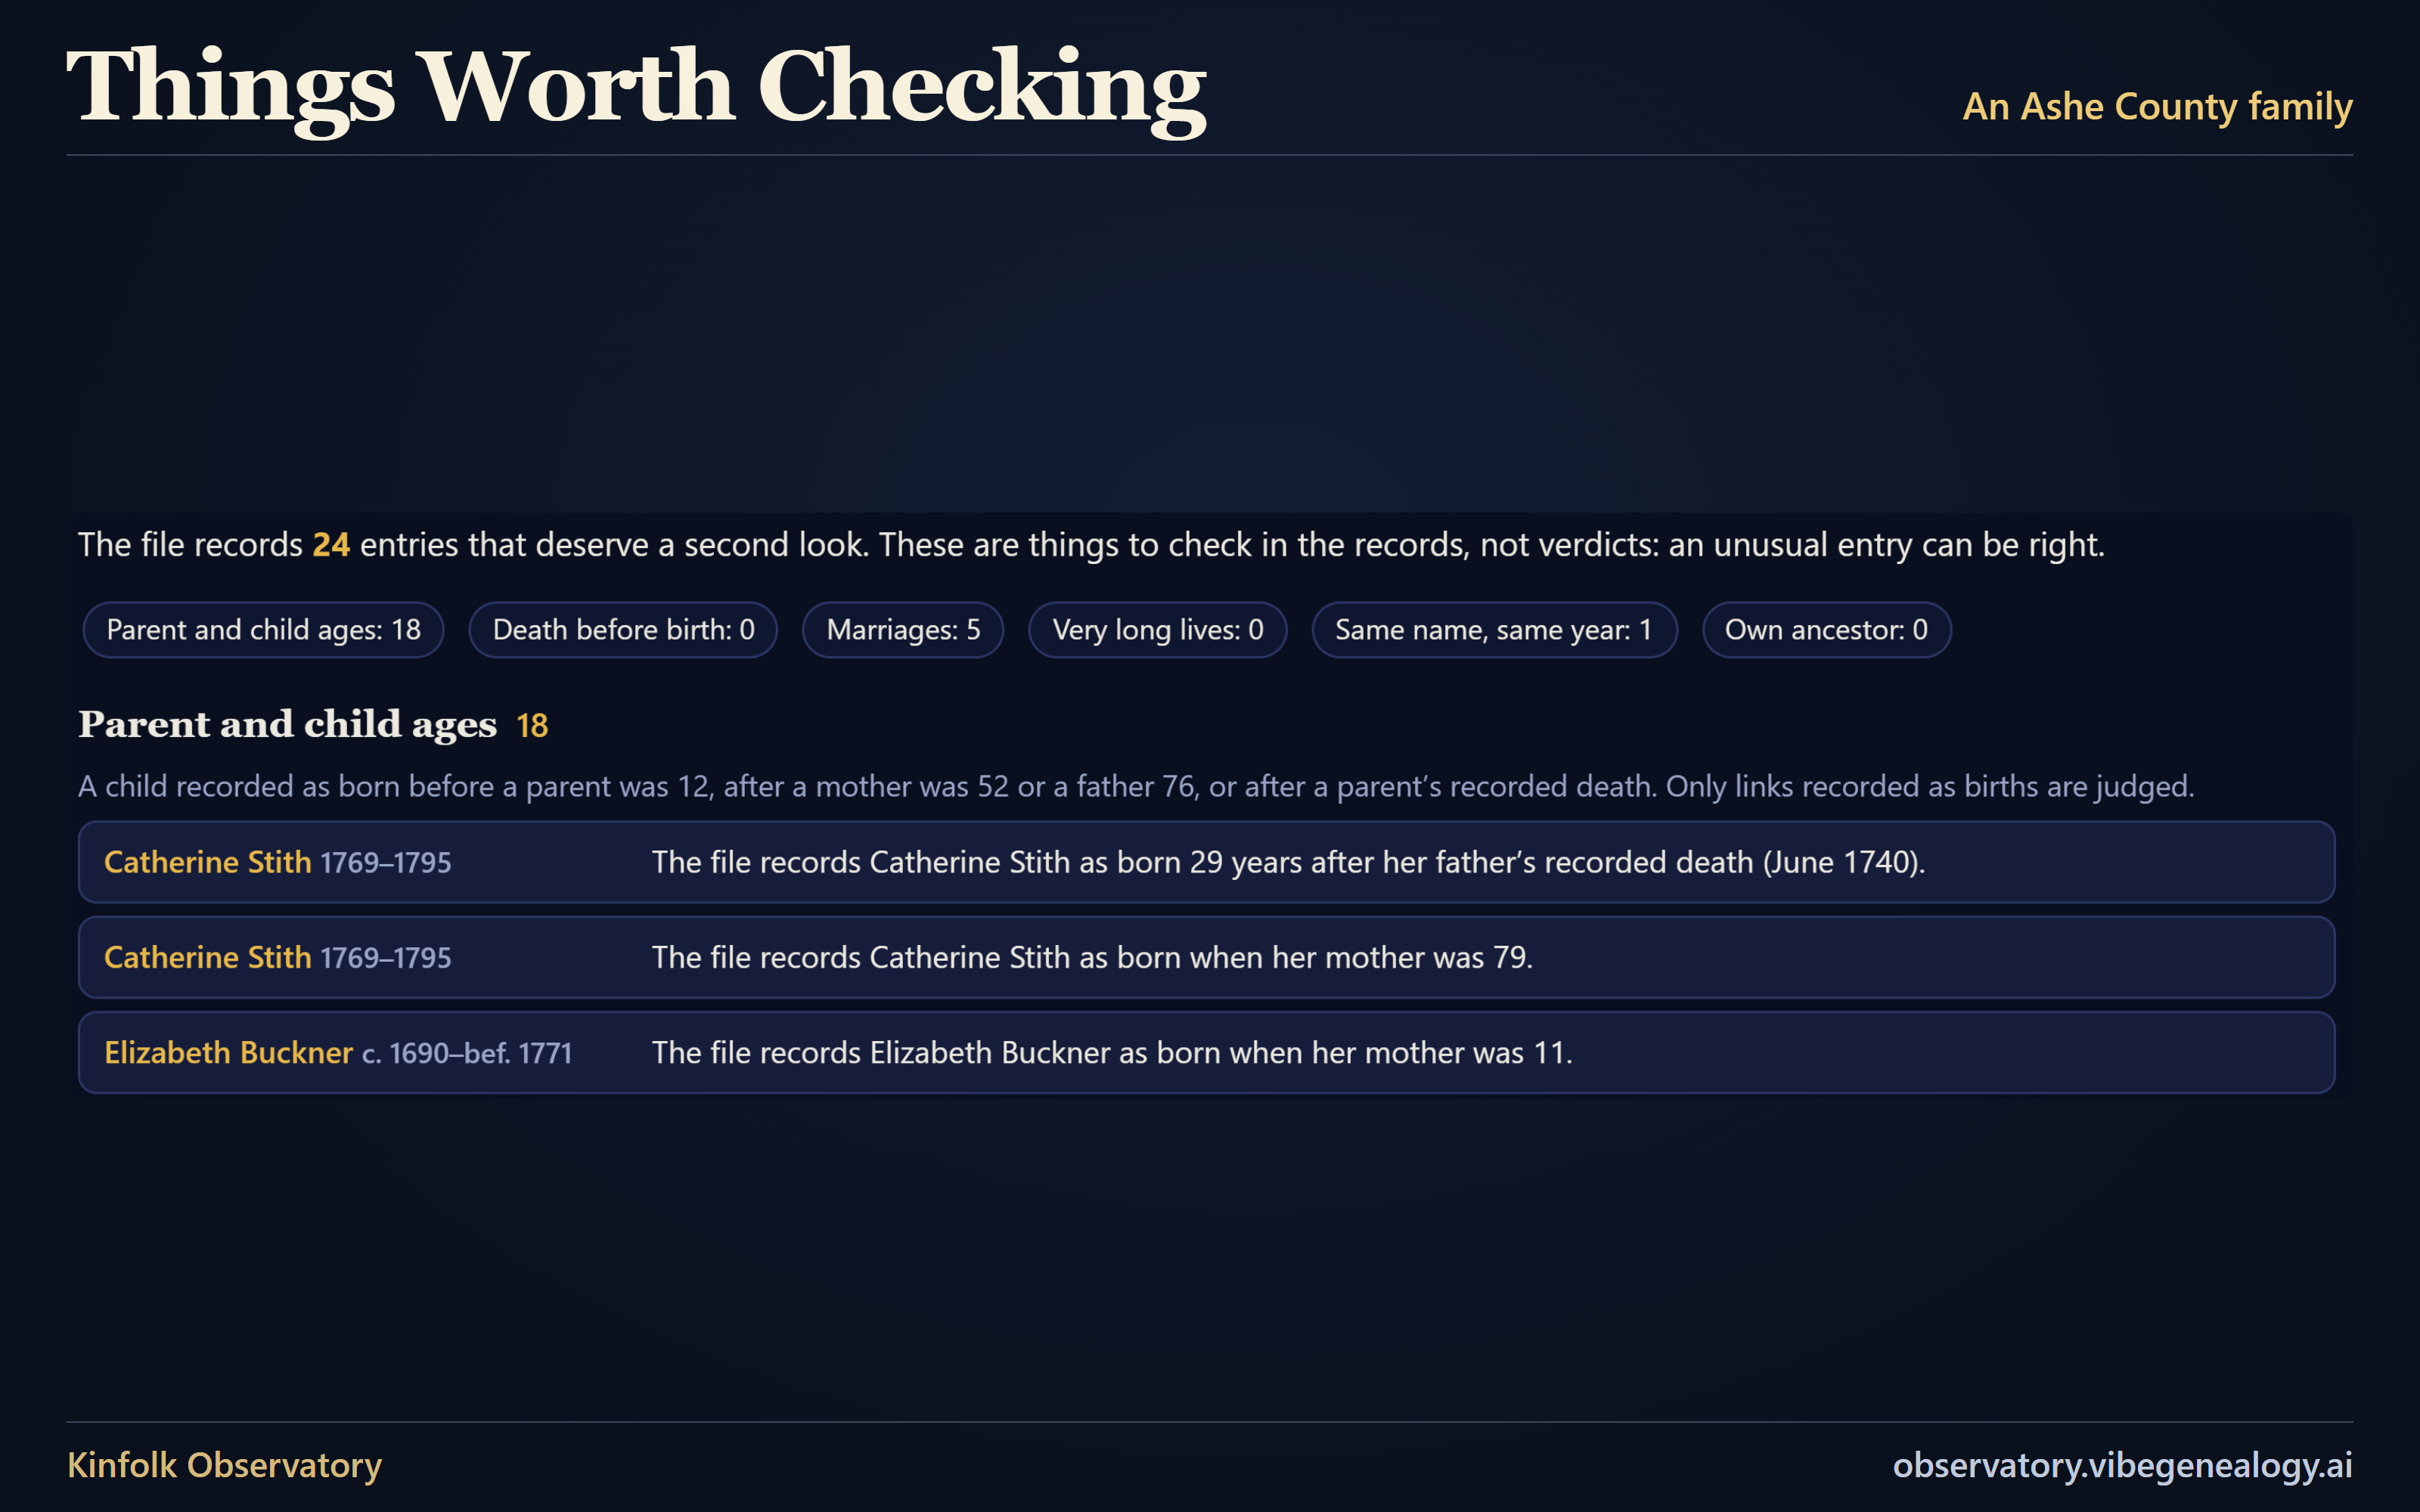
The page lists entries that look unusual, such as a child recorded as born before a parent was 12, or after a parent’s recorded death. These are things to check, not verdicts. They are questions about the records, not about the people. Mine records Catherine Stith as born in 1769, which is 29 years after her father’s recorded death and when her mother was 79. That is a good reason to check the original record, and whether the right people are linked.
13. What’s Missing
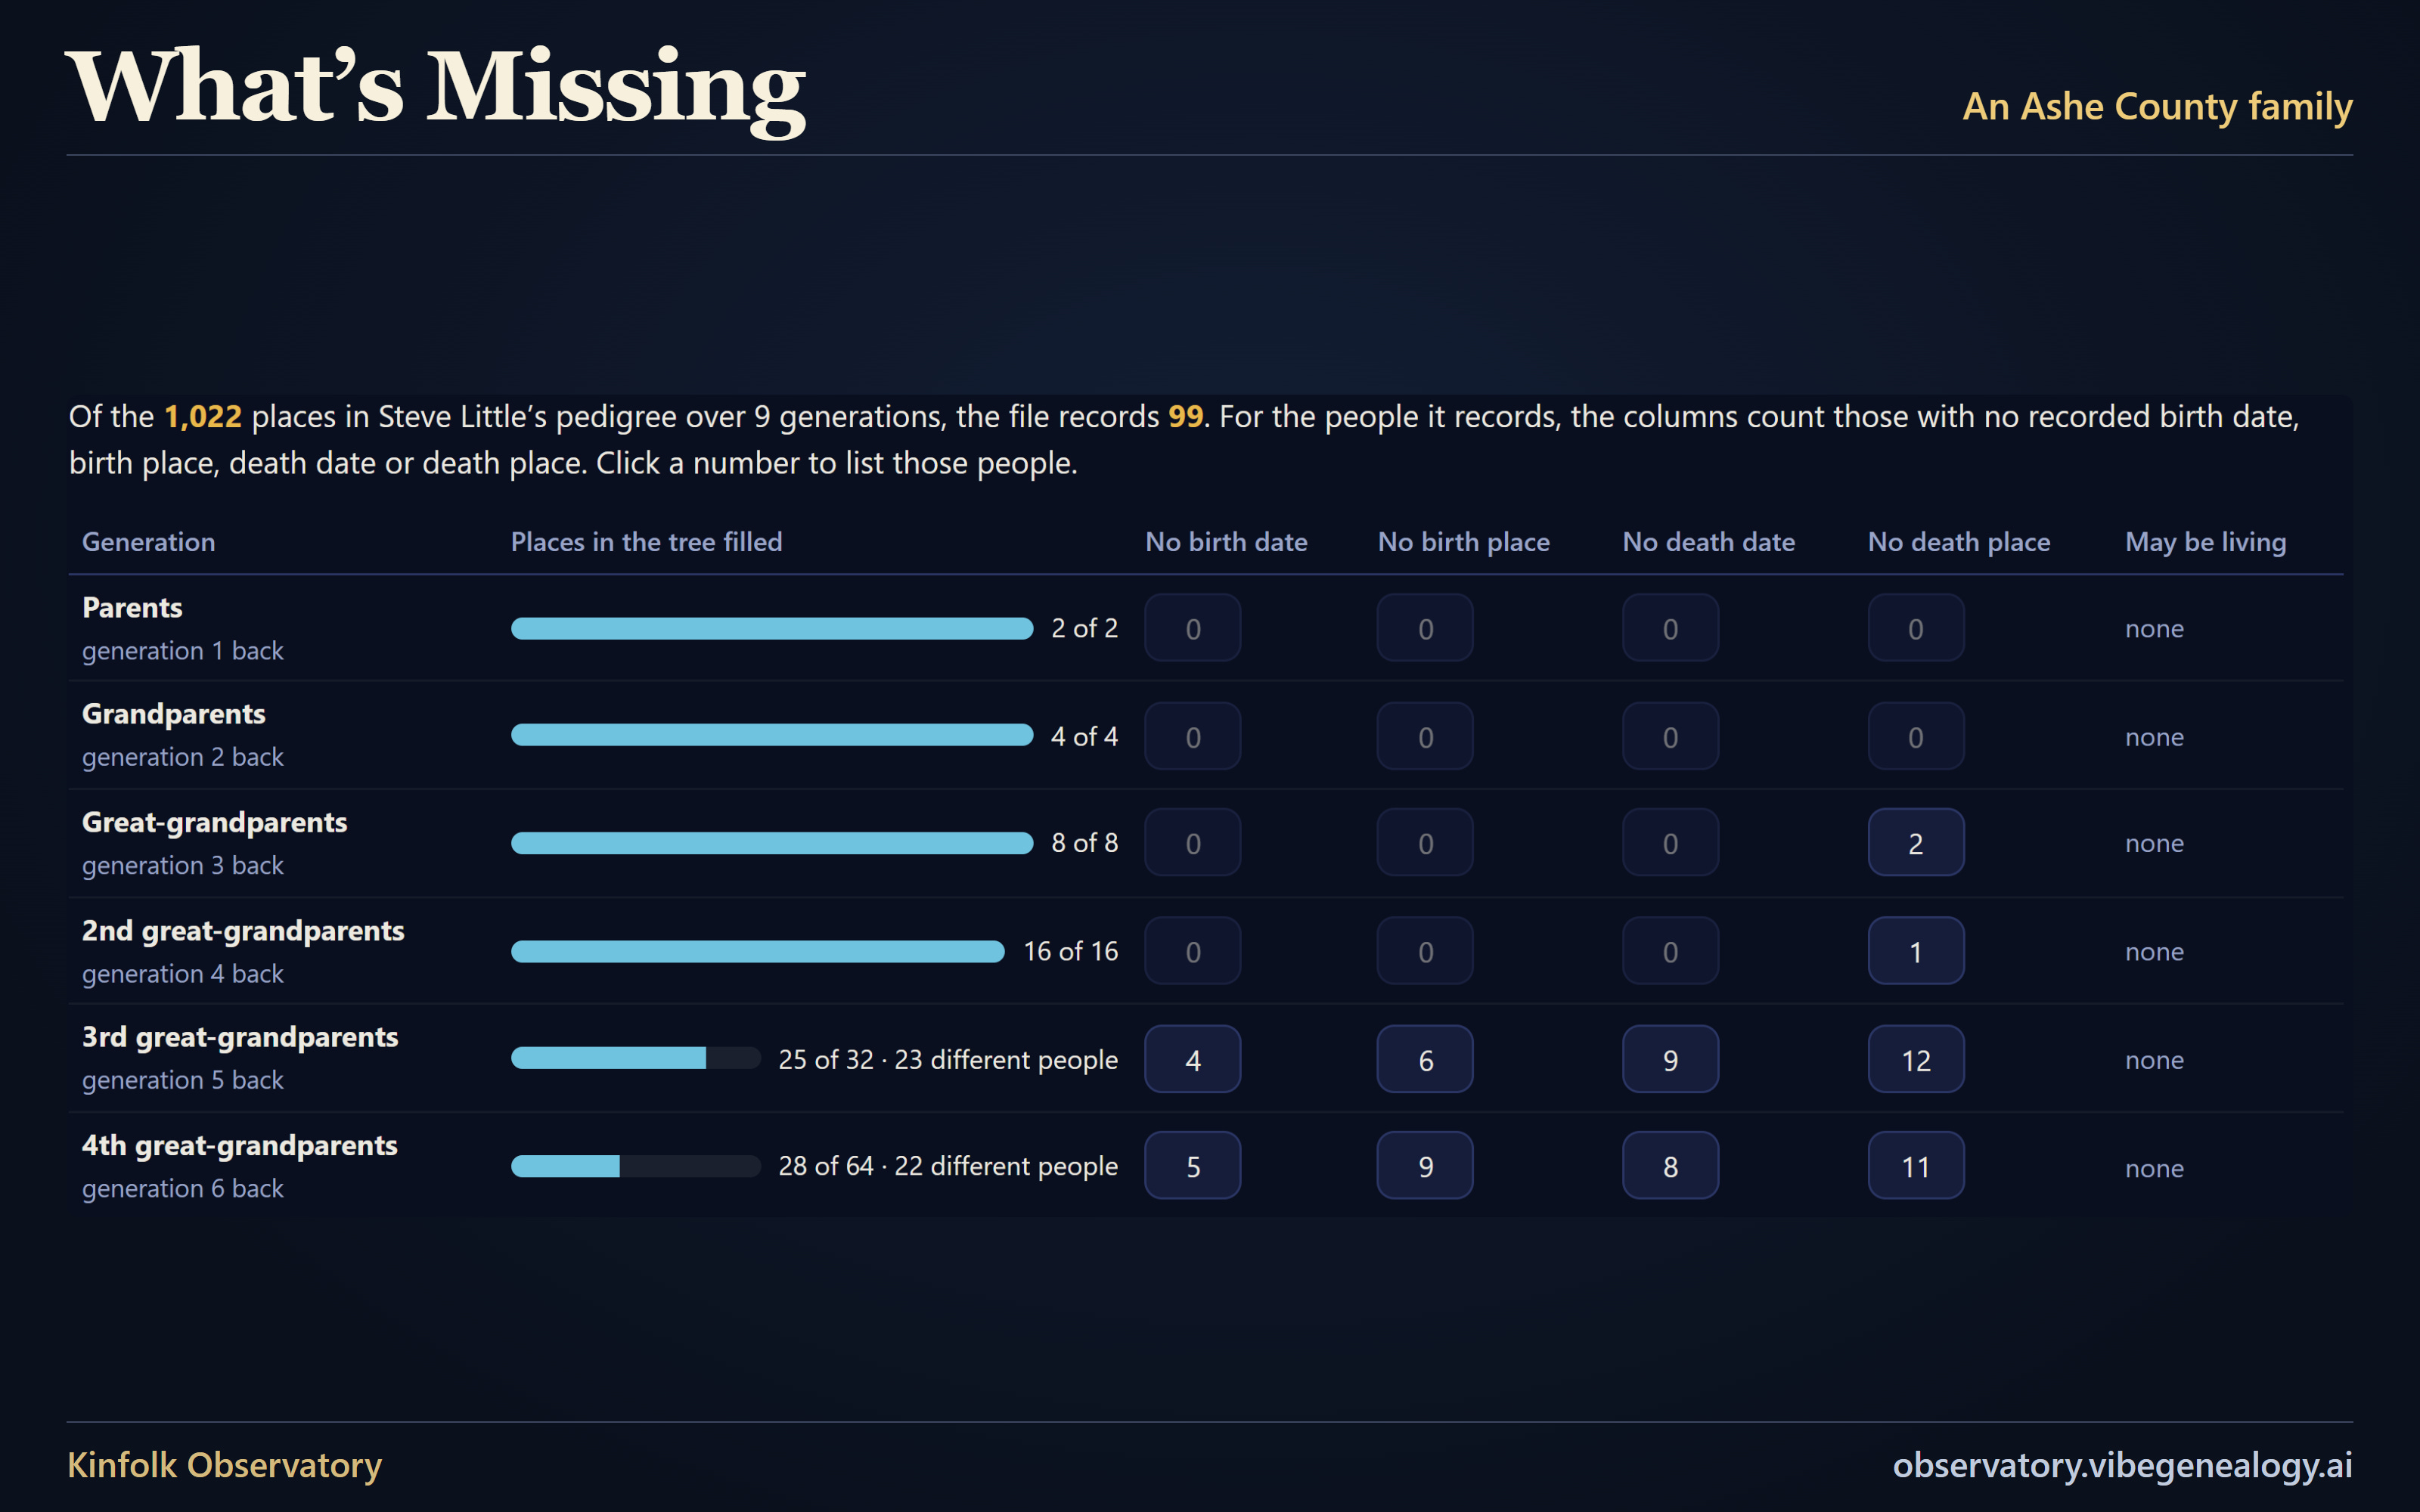
For each generation of ancestors, a bar shows how many of the possible places have a person in them, and the columns beside it count the people whose birth or death details are not recorded. Click one of those counts to see the people on that list. In my father’s tree, every place is filled through his 2nd great-grandparents, all 16 of them. One generation further back, 25 of 32 places are filled, by 23 different people. That is where the brick walls begin: places I can still investigate.
All 13 views are waiting at
https://observatory.vibegenealogy.ai/
. There is nothing to install and no account to make. Choose An Ashe County family from the Family menu to click through these same pictures, or load your own file.
If you try one view, I’d love to hear what you noticed or where you got stuck. One sentence is plenty. Please leave out names and family details. Send feedback using the one-question form, or open the same form with Tell us what you think at the bottom of the Observatory or on its About page.